Understanding the demographic and economic future is essential for sound decision-making. There are a lot of questions we can ask about the future to guide this process.
- What will Southeast Michigan communities look like in the next 30 years? The region’s population has been growing in the past six years. It will continue to grow, but only at about 1/3 of the national rate.
- How can communities attract more people? Our region is moving towards a knowledge-based economy.
- With jobs shifting away from retail and manufacturing to health care, engineering, IT, and other industries that require more education and skills, what jobs can a community target through zoning?
- What will the impact be on infrastructure usage?
- How do we redesign the use of retail spaces? Will we see more health service providers in our strip malls?
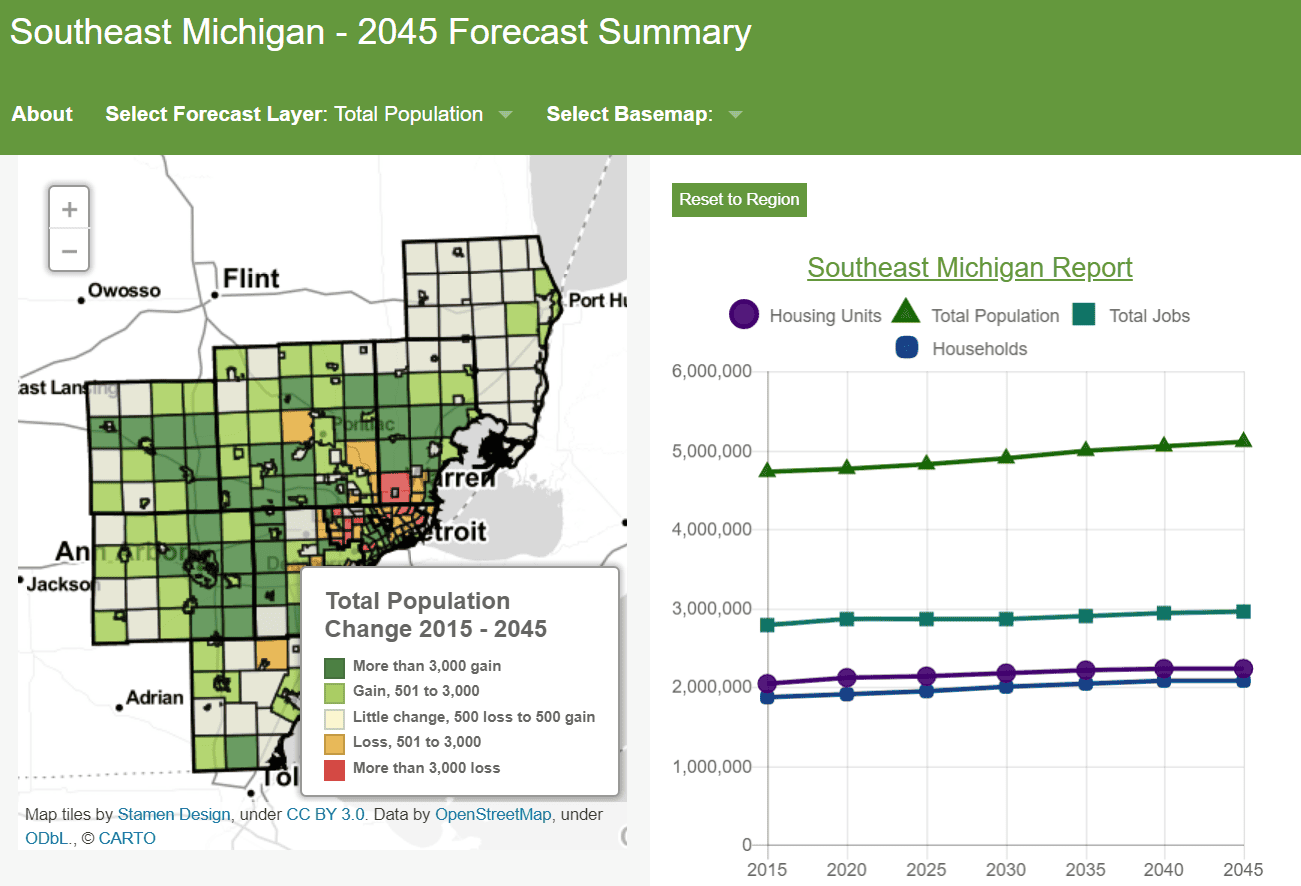
SEMCOG recently released its 2045 forecast of population, households, and jobs for communities in Southeast Michigan. The forecast serves as the basis for regional infrastructure plans and local community development plans. It is also the key input for the long-range regional transportation plan. An interactive map helps visualize the forecast.
This map opens to display the community forecast of total population change for all of Southeast Michigan, from 2015 to 2045. To view the forecast numbers for a specific county or community, simply click on them. When you zoom into a community, a series of colored points will appear. They represent recent or expected future construction events, and serve as a key input into the forecast. In addition to the total population map, there are also map layers for forecast households, housing units, jobs, senior population, and youth population. Additionally, you can add satellite images or roads to the map as backgrounds.
Alongside the map, a line chart depicts the projected trends and relationships among population, households, housing units, and jobs for any selected area. Furthermore, you can view a forecast report for the selected area, which contains additional information, including population by age cohort, households by type, and jobs by employment sector.
We hope that this interactive map will not only help users find detailed data about communities in the region but also help all of us to think about the implications of socio-economic trends and take actions to create a better future. Here are some questions you may want to consider.
- “Diversifying the economy” has been a mantra for decades. How can economic diversification apply to your community?
- The senior population will grow substantially. What does a 65% increase in population aged 65 and over mean to a community and the mix of services you provide?
- What is the impact of a rapid increase of individuals aged 85 or older on housing, health care, and transportation?
In the near future, we will add additional data and geographies to the map, including data for transportation analysis zones and school districts. Those are critical for our region’s infrastructure planning and success in education and adapting to the changing needs of our future workforce.


Leave a Reply