“By the Numbers” is a series of short articles evaluating the finances of Michigan local governments, primarily through the use of U.S. Census reports on Local Government Revenues and Expenditures by Type of Government, and State and Local Government Revenues and Expenditures. The articles will look at how Michigan compares over time to the rest of the nation.
Several articles will benchmark changes in revenues for local governments comparing the years 2002, 2007, and 2012. Changes in revenue collections, as well as transfers from the State and Federal governments, will be evaluated for each type of local government in Michigan – municipalities, counties, townships, and school districts.
Later in this series, articles will benchmark Michigan’s state and local expenditures on various categories of services on a per capita basis as compared to other states, using information from 1992, 1997, 2002, 2007, and 2012.
Finally, the results will be evaluated overall with a critical look at Michigan’s current system of funding local governments and the services they provide.
This installment, fourth in the series, looks at school district revenues.
Schools
General Revenue
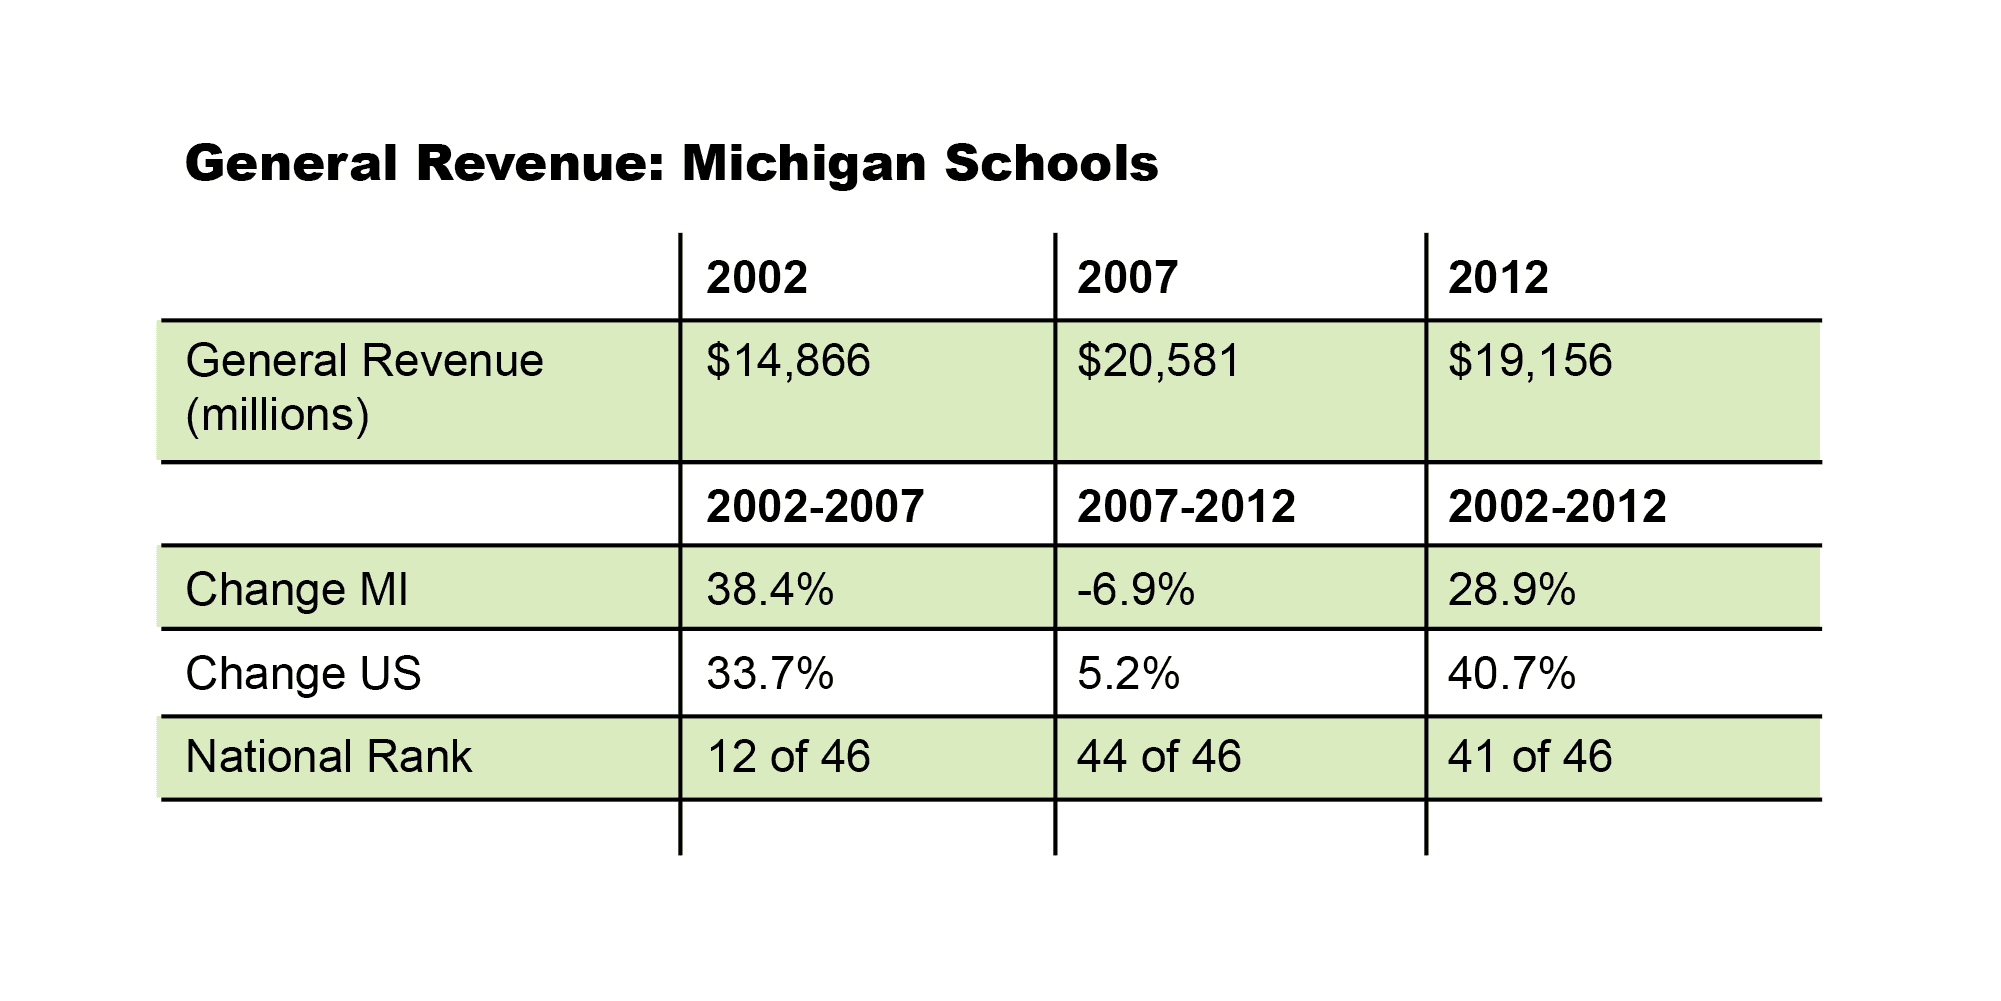
The U.S. Census numbers for Michigan’s local school districts show that despite strong growth from 2002-2007, Michigan did not fare well nationally when looking at funding growth from 2002-2012. General Revenue for school districts in Michigan increased by 28.9 percent from 2002 to 2012, placing Michigan 41st in the nation out of the 46 states that had local school districts. The national growth rate was 40.7 percent.

Schools in Michigan saw their General Revenues increase from $14.866 billion in 2002 to $20.581 billion in 2007. This 38.4 percent increase placed Michigan 12th in the nation in school district funding growth, and above the national average of 33.7 percent. The results for Michigan look much different in the 2007-2012 timeframe. Total General Revenues declined from $20.581 billion to $19.156 billion over these five years. Only two of the 46 states being evaluated saw larger losses than the 6.9 percent decline seen by Michigan schools. Overall, local school districts in the country saw a 5.2 percent increase in General Funds from 2007-2012.
Own Source of Revenue
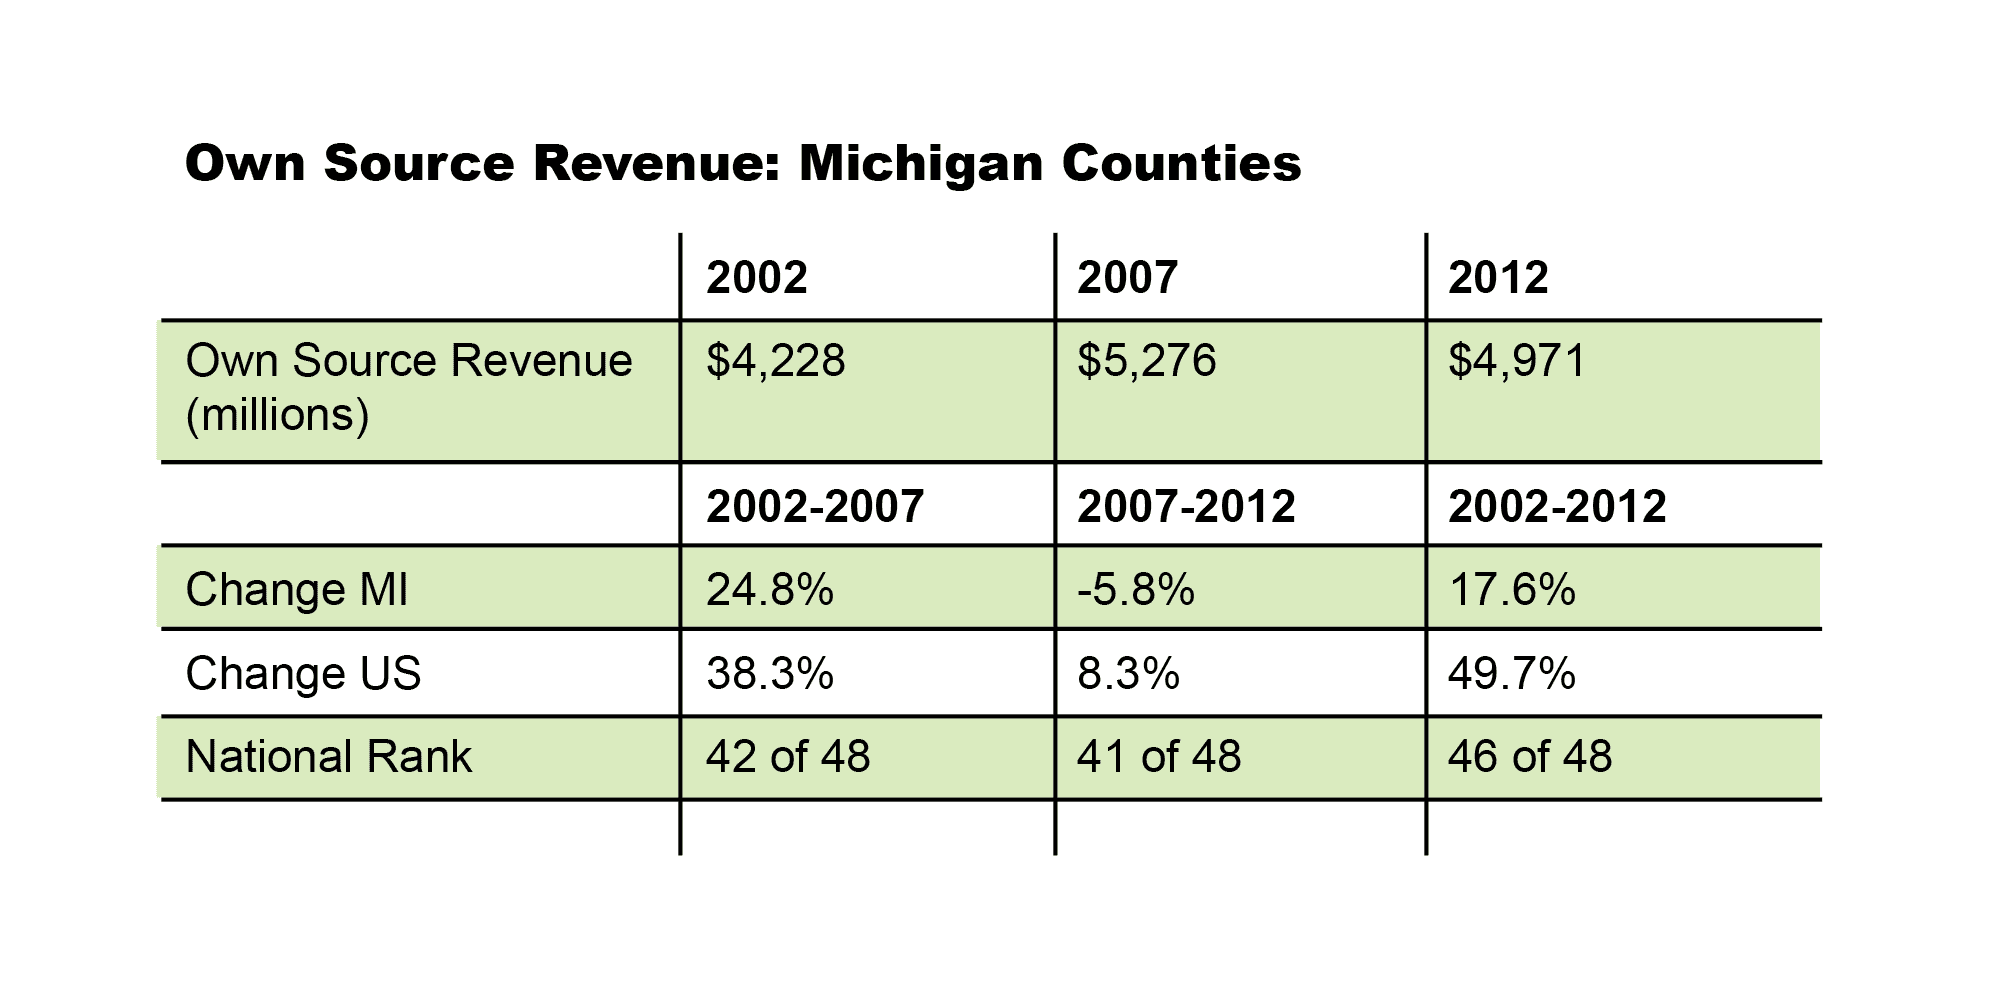
In 2002, Michigan School Districts collected $4.698 billion in revenue from taxes and charges for services. By 2007, this amount had jumped to $7.879 billion. This 67.7 percent increase in local revenue placed Michigan sixth in the nation in this category. This growth was thrown into reverse over the next five years when total local revenue decreased by 10.1 percent, from $7.879 billion to $7.084 billion. In five years, Michigan slipped from sixth best to third worst, in the nation in local revenue growth. Michigan’s 50.8 percent local revenue growth rate was very close to the national average of 46.0 percent from 2002-2012.

Federal Revenues
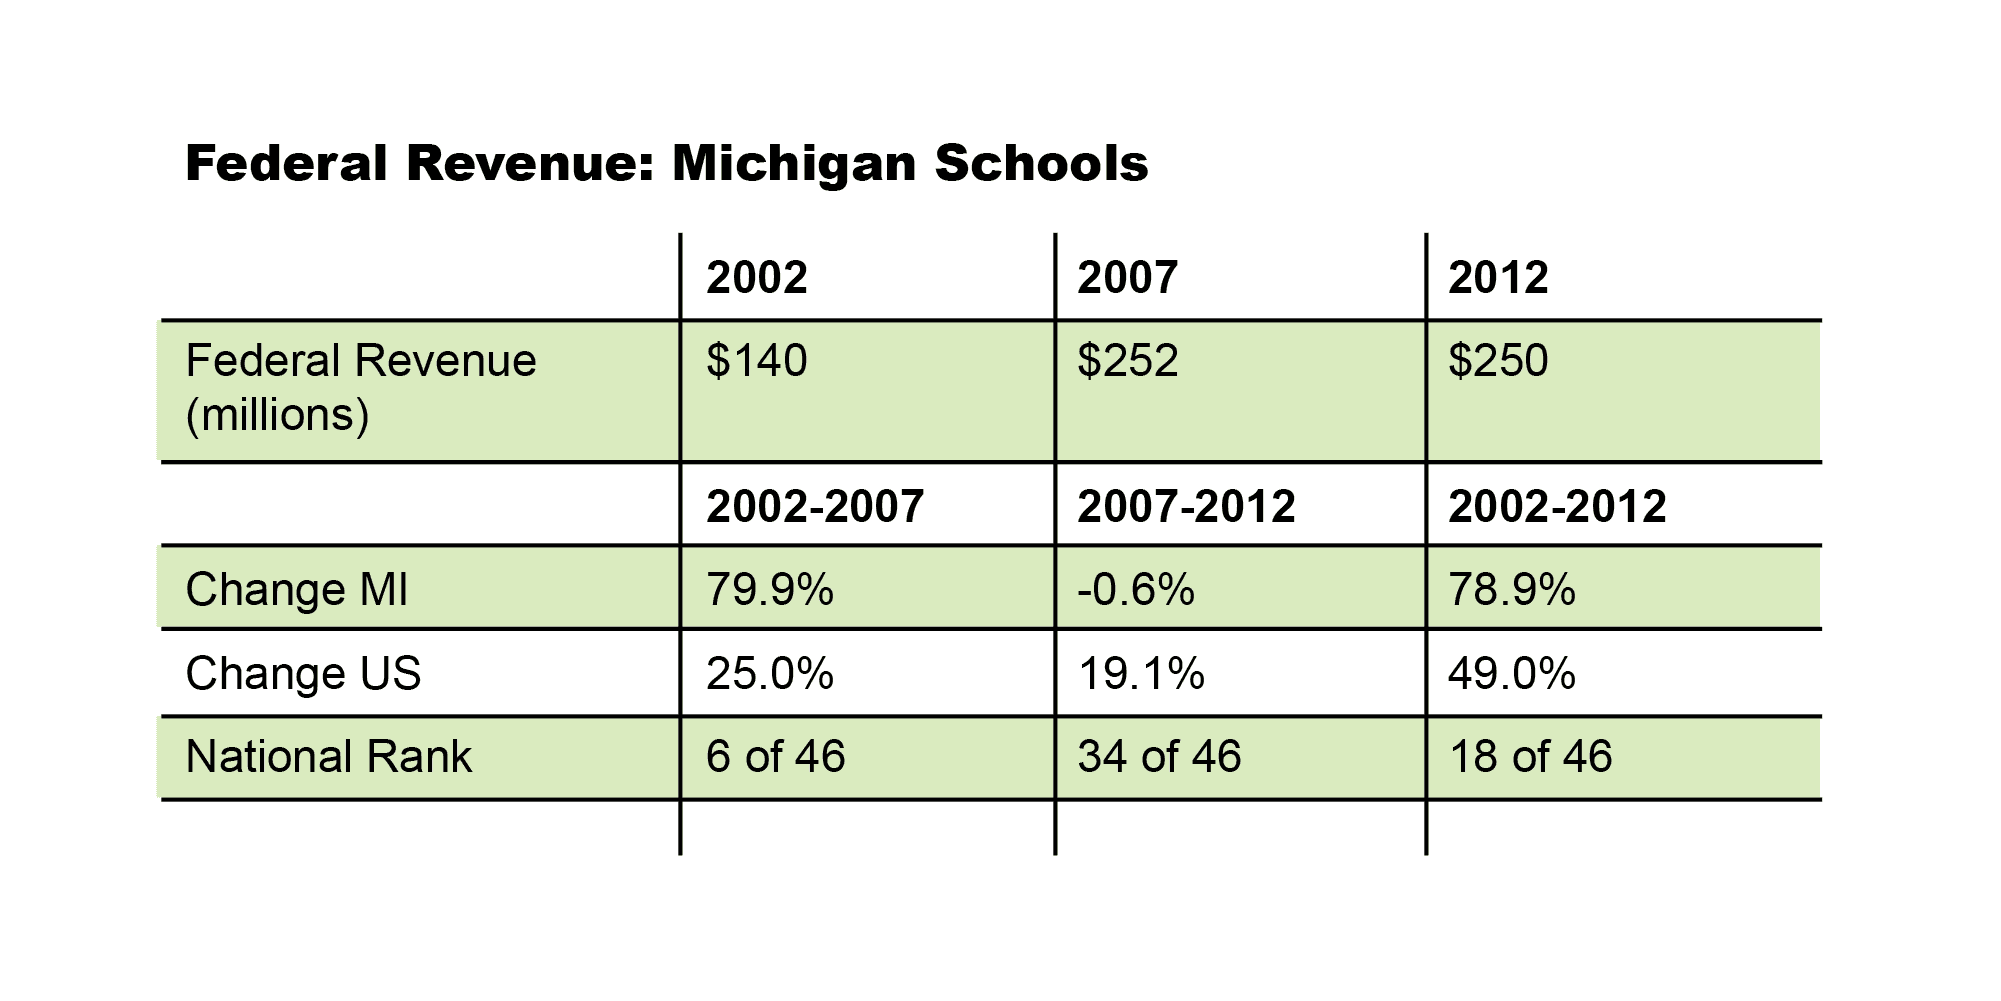
In 2002, the federal government provided $140 million to Michigan school districts. By 2007, the amount of federal aid had jumped to $252 million. The 79.9 percent jump in federal funding for Michigan was more than triple the growth rate for school districts nationally. Michigan was sixth nationally in the rate of growth for federal funds. After 2007, the growth in federal funds came to a halt, as federal funding from 2007-2012 was slightly reduced from 252 million to 250 million. This placed Michigan in 34th place in the nation over the five-year span. Over the total 10-year span, Michigan saw its federal funding increase by 78.8 percent, which was well over the national average of 49.0 percent. Michigan placed a respectable 18th in the nation in federal revenue growth over the course of this review.

State Revenues
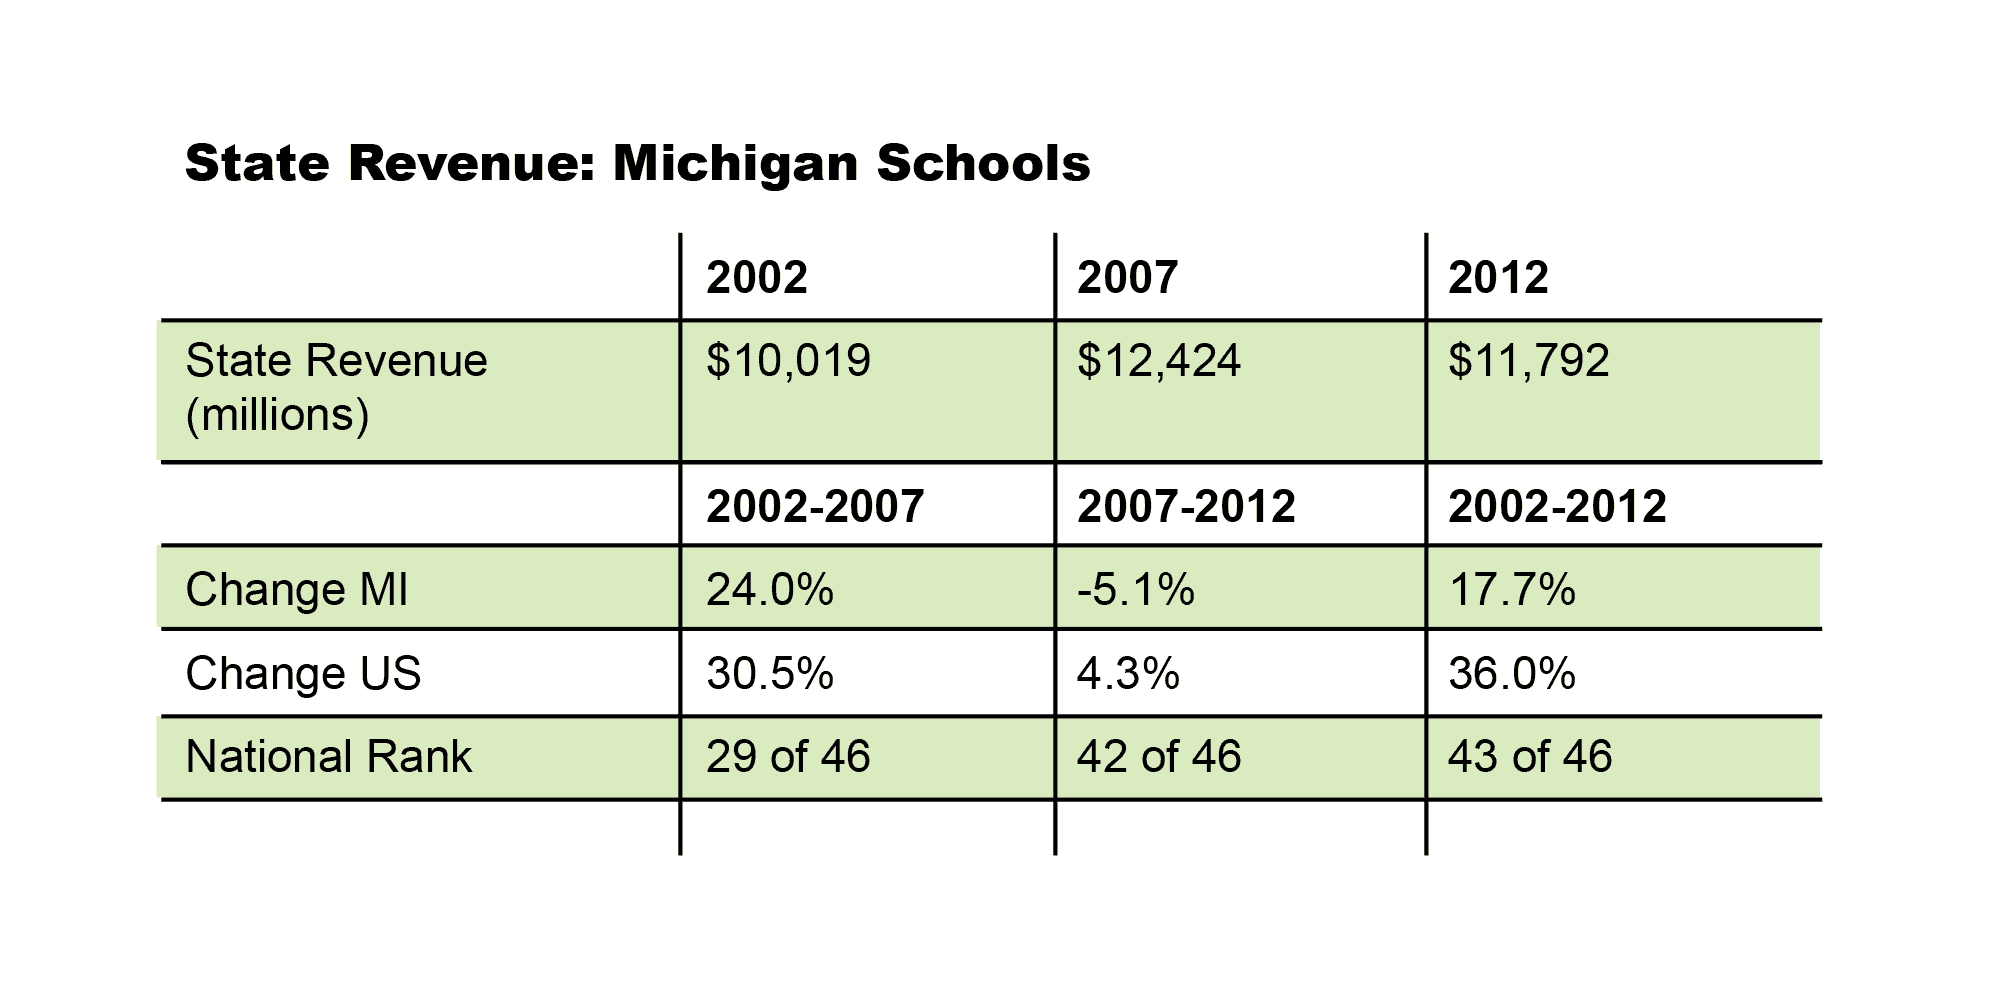
In 2002, the state provided $10.019 billion in support to local school districts, which includes Intermediate School Districts (ISDs) and Community Colleges. By 2007, state support for school districts had increased to $12.424 billion. This 24.0 percent increase was a bit below the national increase in state support for schools districts, which was 30.5 percent. Michigan ranked 29th in the nation in the growth of state support for schools from 2002-2007.

Once the Great Recession took hold, funding for schools was impacted across the nation. Nationally, state support for school districts increased by only 4.3 percent from 2007-2012. Michigan failed to keep pace with the nation; state support for school districts fell from $12.434 billion to $11.792 billion. This 5.1 percent drop in revenues resulted in Michigan placing fourth from last in the nation in its support of local schools from 2007-2012.
State support for schools in Michigan does not compare well against the nation looking at the 2002-2012 time period. State spending increased by only 17.7 percent over the course of 10 years. This is less than half of the national average increase of 36.0 percent. Michigan ranked 43rd out of 46 in the nation in growth in state support for school districts.
Conclusion
Local school districts saw a significant decline in financial support from 2007-2012. Overall, school funding saw a reduction during this time period, with only two states being harder hit than Michigan. Local revenues fell during this time period as did state support for local schools. While the numbers are a little less bleak over the broader time period of 2002-2012, being ranked 41st out of 46 states and growing at three-quarters of the rate of the nation overall are not figures that inspire confidence.

Leave a Reply