“By the Numbers” is a series of short articles evaluating the finances of Michigan local governments, primarily through the use of U.S. Census reports on Local Government Revenues and Expenditures by Type of Government, and State and Local Government Revenues and Expenditures. The articles will look at how Michigan compares over time to the rest of the nation.
Several articles will benchmark changes in revenues for local governments comparing the years 2002, 2007, and 2012. Changes in revenue collections, as well as transfers from the State and Federal governments, will be evaluated for each type of local government in Michigan – municipalities, counties, townships, and school districts.
Later in this series, articles will benchmark Michigan’s state and local expenditures on various categories of services on a per capita basis as compared to other states, using information from 1992, 1997, 2002, 2007, and 2012.
Finally, the results will be evaluated overall with a critical look at Michigan’s current system of funding local governments and the services they provide.
Cities
General Revenue
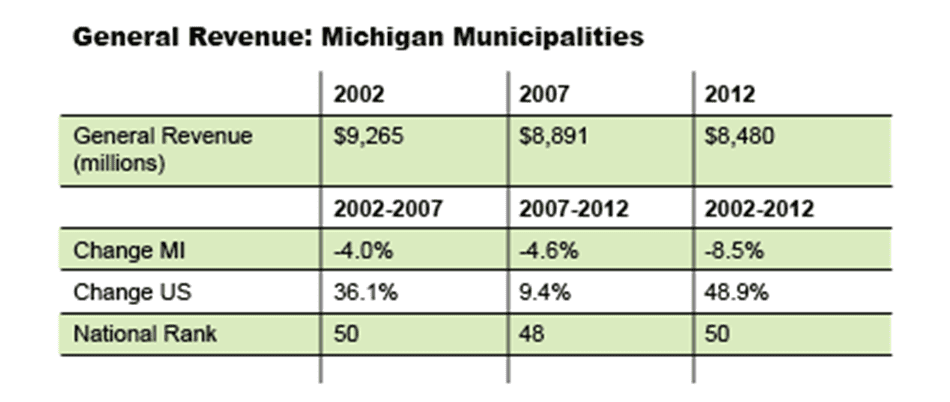
According to the U.S. Census, from 2002 to 2012, Michigan municipalities saw a startling 8.5 percent decline in General Revenues. This compares to the national average increase of 48.9 percent for all cities in the nation. Michigan wasn’t just at the bottom of the list in the revenue growth for cities – it wasn’t even close to the rest of the nation. For perspective, Ohio cities were ranked 49th in the nation in revenue growth, and they still saw a 25 percent increase over the decade.

In the 2002 U.S. Census Report, municipalities in Michigan (cities and villages), were shown having $9.265 billion in General Revenue. In 2007, General Revenue had fallen to $8.891 billion and by 2012 revenues had further fallen to $8.480 billion. From 2002-2007, Michigan was the only state in the nation where municipalities saw a real decline in General Revenue, that being 4.0 percent. The nation, as a whole saw, revenues flowing to its cities increase by 36.1 percent during that time. The growth rate of revenues for all municipalities across the nation slowed significantly from 2007-2012. While Michigan municipalities saw another 4.6 percent loss during this time period, nationally municipalities saw a modest 9.4 percent growth in revenue.

Local Sources of Revenue
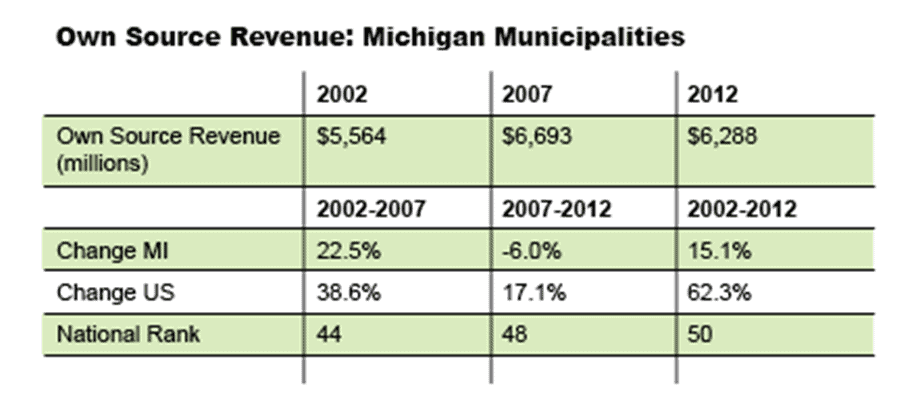
The U.S. Census tracks revenues by three general categories: Federal, State, and Own Source. Of the three revenue categories, revenue generated by local governments through their own sources is the most critical for cities. In 2002, Michigan cities generated $5.564 billion in revenue. By 2007, these self-generated revenues had increased to $6.693 billion, but then dropped to $6.288 billion by 2012.
The true perspective of the financial health of Michigan’s cities and villages are best observed over the combined 2002-2012 time period. Nationally, local revenue from taxes and fees for cities and villages increased by 62.3 percent. However, Michigan’s cities and villages only saw a growth rate of 15 percent, a quarter of the national average. Michigan ranked dead last in the nation in its tax and fee growth from 2002-2012.

Nationally, the impact of the Great Recession is very noticeable when comparing Own Source revenue growth between 2002-2007 and 2007-2012. Across the nation, municipalities saw an increase of just over 17 percent between 2007 and 2012 in tax and fee collections. That is less than half of the 38.6 percent increase seen in the prior five-year period. Michigan fared poorly in both time periods. Michigan’s revenue growth was only 22.5 percent during the “good times” from 2002-2007; over the next five years, it had a six percent loss.
Federal Revenue
Federal revenue is the smallest component of the three categories of revenue for Michigan municipalities, comprising less than 10 percent of the total. Census records indicate that Michigan cities received $608 million in federal funding in 2002, then saw a significant decrease to $479 million in 2007, followed by a large increase to $670 million in 2012. When looking at the overall picture from 2002-2012, Michigan fares poorly, ranking 46th in the nation, with an overall change of 10.2 percent. This is less than one-fifth of the national growth rate of 55.4 percent during the 10-year time period.

State Revenue
State financial assistance is an extremely important component of Michigan’s municipal finances. During the overall period of the study, Michigan once again ranked last in the nation in changes in state support for municipal operations. Nationally, revenues transferred from state governments to their cities increased by 23.8 percent from 2002-2012. In Michigan, cities experienced a 57 percent decline over the course of this 10-year period.

From 2002-2007, Michigan was last in the nation in revenue growth from state sources. While there was a modest 16.1 percent growth in state revenues flowing to municipalities nationally, Michigan cities were dealing with a 49.6 percent decline. The census numbers highlight the national impact of the Great Recession on state funding for local municipalities across the nation from 2007-2012. Michigan saw the amount of state revenues flowing to cities declined by 14.7 percent, reduced from $1.563 billion to $1.333 billion over the course of those five years. Nationally, seven other states saw even larger declines. Nationally, transfers from state governments to municipalities only grew by 6.6 percent as governments struggled to deal with the impacts of the recession.
Conclusion
The financial challenges facing Michigan’s cities were unmatched anywhere else in the nation from 2002-2012. During that time, Michigan municipalities were last in revenue growth generated from taxes and fees. Michigan was last in revenue growth from appropriations from the state and 46th in the nation in revenue growth from federal sources. Michigan municipalities weren’t just last in the nation in overall revenue growth from 2002-2012, they weren’t even in the same picture with the rest of the nation.

Leave a Reply