SEMCOG
Southeast Michigan Council Of Governments
Menu

Home Blog data Page 7

Blog The SEMCOG team covers a range of topics, projects, services, and issues important to Southeast Michigan and its local governments. category: data

bicycle and pedestrian travel
A person sits in the driver’s seat of a car, holding a smartphone up with one hand while driving on a roadway with traffic cones ahead.

Distracted Driving and Work Zone Awareness

Distracted Driving Awareness Month reminds us that it is important to maintain safe driving habits and stay alert behind the wheel each and every day.
Jon ClarkApr. 14 2022
bicycle and pedestrian travel
Close‑up of hands holding and tapping on a smartphone, with digital graphics and glowing network elements surrounding the device.

Big Data

A byproduct of increased connectivity is the massive amount of data generated. Safely aggregated and stored, it can be used to improve transportation systems.
Chris WilliamsMar. 15 2022
bicycle and pedestrian travel
A person walks on a snow‑covered, brick‑patterned path using a cane for support, with winter conditions visible around them.

Spring into Effective Planning with SEMCOG’s Bicycle and Pedestrian Counts Map

Planners Chade Saghir, Data Analysis, and Brian Pawlik, Modeling and Mobility, integrate count data to improve experiences for all transportation system users.
Chade SaghirFeb. 21 2022
data
Logo reading “United States Census 2020” in bold red text on a white background.

How Can Communities Challenge 2020 Census?

In many communities, some may wonder why the new Census numbers for poulation or housing unit counts are different from what they have anticipated or observed.
Sirisha UppalapatiJan. 26 2022
regionalism
Person standing and speaking at the front of a conference room, addressing attendees seated at tables while a panel of speakers sits at a long table near a projection screen.

Challenges to Keep Coming; Let’s Move Forward Together

Orion Township Supervisor Chris Barnett discusses leadership challenges and opportunities for collaboration in SEMCOG.
SEMCOG Southeast Michigan Council of GovernmentsJan. 11 2022
data
Aerial view of tall, reflective office buildings with gold‑tinted windows standing beside a multi‑lane highway, surrounded by trees, smaller buildings, and open green areas under a cloudy sky.

Crash Responders Safety Week

This week highlights roadway safety for workers. It takes diligence from every responder, driver, and passenger to help save lives at the scene of a crash.
Chris WilliamsNov. 9 2021
data
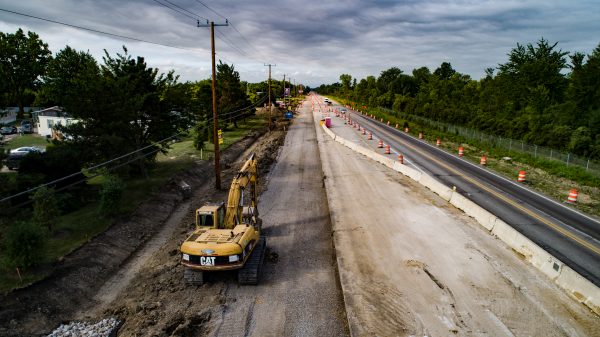
Road construction site with heavy equipment, including an excavator working along a torn‑up roadway, with traffic cones and barriers separating the active construction area from an open travel lane.

Practical Asset Management Planning

Experts from the City of Detroit, Macomb County Department of Roads, and MDOT discuss the development of transportation asset management plans.
Ed HugJul. 20 2021
community and economic development
Map titled “Laborshed – Linking Residents to Workplaces,” displaying Southeast Michigan with shaded areas ranging from light to dark red to represent where workers live relative to their job locations. A left-hand panel includes filters for community, worker categories, and job types, while a legend in the lower right shows the scale of workers by residence concentration.

Linking Residents to Workplaces – A New SEMCOG Mapping Tool

Laborshed in Southeast Michigan identifies where workers live, work, and their commutes. It is a valuable tool to connect workers to employers.
Brian ParthumApr. 6 2021
data
A screenshot of an online SEMCOG dashboard titled “Covid‑19 Tracking,” displaying regional statistics including daily increases, daily testing, and the positive rate. Several charts show data trends for Southeast Michigan, including daily COVID‑19 increases, daily testing totals, cases per million, testing per million, and positive rates. The page includes a left‑side description explaining the link between public health and economic recovery, while the top navigation bar highlights sections such as Business Climate, Labor Market, and Place. The layout uses multiple colored graphs and numeric indicators to present pandemic‑related information.

Timely Socio-Economic Data

Two new interactive tools to visualize the changes in our region's economy over time: Economic Indicators and High-Frequency Socio-Economic Dashboard.
Brian ParthumFeb. 9 2021
community and economic development
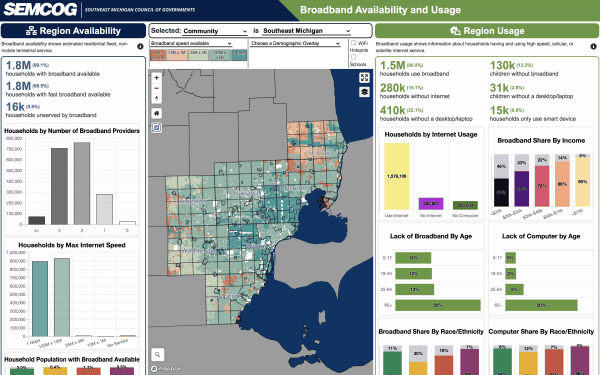
Dashboard showing broadband availability and usage across Southeast Michigan, featuring a central map with color‑coded census areas indicating variations in broadband access. Panels on the left display statistics including households with broadband available, maximum internet speeds, and the number of broadband providers. Panels on the right present data on broadband use, such as households using broadband, households without internet, computer ownership, lack of broadband by age, and broadband share by race or ethnicity. Bar charts and colored graphs summarize disparities in access and usage, while dropdown filters at the top allow users to select communities and demographic overlays.

Broadband Availability and Usage

The recently updated Broadband Availability and Usage Tool displays digital connectivity in terms of residential broadband availability and usage
Naheed HuqJan. 27 2021
« FirstPrev...678Next
SEMCOG| image:
  • Privacy Policy
  • Accessibility
  • Title VI
  • Titulo VI
  • الباب السادس

Helpful Links

  • Event Calendar
  • Regional Transportation Plan (RTP)
  • Metropolitan Affairs Coalition (MAC)
  • SEMCOG Publications
  • SEMCOG Universities
  • Freedom of Information Act

I want to…

  • Learn about SEMCOG Membership
  • See Data from My Community
  • See Maps of the Region
  • Find an Agenda/Meeting Minutes
  • Submit a Public Comment
  • Contact SEMCOG

Connect with us

1001 Woodward Avenue, Suite 1400
Detroit, Michigan 48226
(313) 961-4266
[email protected]
Media - (313) 580-6195

© 2026 SEMCOG | Built by LocalHop