As we approach the end of 2023 and communities plan for next year, there is some good news on the budgetary front for Southeast Michigan’s State Equalized Value (SEV) and Taxable Value. Total taxable value growth was strong, with an overall increase of 7.7%. It was relatively even across all seven counties in the region, ranging from 6.2% to 8.1% (Table 1). The same is true when broken down by residential and nonresidential property, for most counties.
Table 1. Real Property Taxable Value

At 9.8% regionwide, SEV growth was stronger than taxable value. SEV ranged from 8.0% to 11.8% among the seven counties (Table 2). The spike in housing prices has been the main driver. Residential SEV grew anywhere from 8.4% to 12%. Nonresidential growth was strong too, but it remains to be seen in the coming years if the lingering impact of the COVID pandemic, particularly working from home, will have a more significant negative effect on office buildings.
Table 2. Real Property SEV

These numbers are welcoming signs for local government revenues. However, a 7.7% increase in taxable value does not equal 7.7% more in property tax revenue. In many cases, it means local governments will be required to roll back their millage rates because of the Headlee amendment.
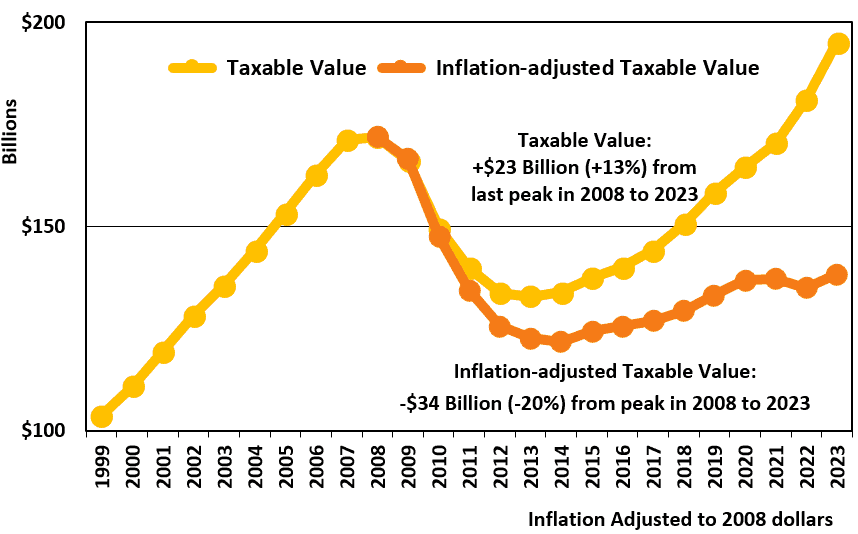
Furthermore, high inflation rates significantly reduce the real SEV and Taxable Value growth. Property values have come a long way since the burst of the housing bubble and the Great Recession that followed. When property values crashed 15 years ago, it created a reset under Proposal A. Since then, taxable value has been growing as the region’s economy improves. Today, the taxable value is $23 Billion or 13%, higher than the previous peak set in 2008 in nominal terms. However, if taxable values are adjusted for inflation, our region is still about $34 Billion, or 20%, below the 2008 peak (Figure 1).
Figure 1. Southeast Michigan’s taxable value has not recovered in real terms

The impact of inflation on real taxable value growth is most pronounced from 2021 to 2022, as shown by the orange line in the above chart. The decline from 2021 to 2022 is due to inflation outpacing taxable value growth for that year (taxable value grew by 6.3% while inflation was 7.9%). With inflation moderating this year, taxable value outpaced inflation (8% vs 5%), leading to a slight gain in inflation-adjusted terms.
The combination of three sources (rising home prices, higher inflation rates, and new development) helps to accelerate taxable value growth. However, the Headlee amendment essentially does not allow local governments to keep the revenues associated with the sale of existing property; Proposal A limits tax value growth to inflation rate or 5%, whichever is lower. Therefore, new construction of residential and commercial buildings remains the only source for real property tax revenue growth.

Leave a Reply