SEMCOG’s newly updated Economic Indicators gives the user the ability to analyze county-level economic data and uncover trends in our region’s economy. You can access them through our Economic Trends page, which features 16 new interactive charts. There are now a total of 30, which are organized into the following categories:
- Business
- Talent
- Place
- Prosperity
Jobs by Industry
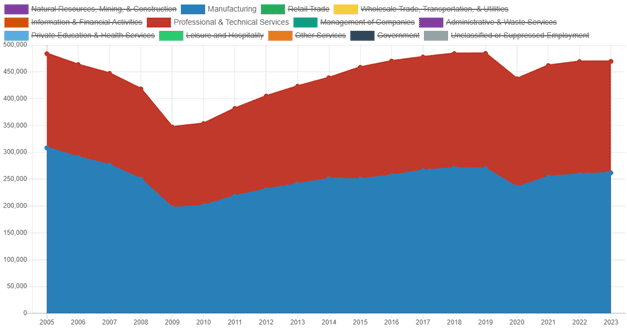
Let’s look at the wage and salary jobs by industry for Southeast Michigan (Figure 1). Two of our largest sectors are Manufacturing and Professional & Technical Services; combined, these two sectors make up almost 470,000 jobs in 2023. However, this figure is almost 15,000 jobs lower since 2019. As you can see, neither returned to their 2019 levels, after dropping (-13% for Manufacturing and -6% for Professional & Technical Services) during the COVID recession of 2020.
Figure 1
Wage & Salary Jobs by Industry, Southeast Michigan

Job Concentration
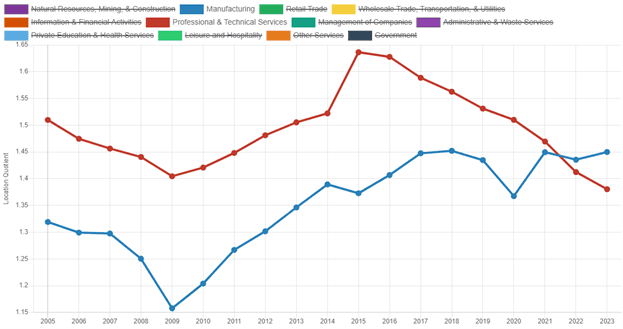
A second chart on each sector’s location quotient reveals mixed news (Figure 2). Location quotient measures the concentration of jobs relative to a base figure; in this case, the national average. A value greater than 1 means the region is more concentrated in this sector than the nation; whereas a value less than 1 means the region is less concentrated than the nation. More concentrated industries tend to export their goods or services to other regions, forming the base of economic growth.
The rebound in Southeast Michigan’s Manufacturing sector has been strong relative to the nation. While dipping during the COVID recession to 1.37, the region’s concentration of Manufacturing employment returned to 2019 levels with respect to the nation. It stands at 1.45 times greater than the national average. However, the same cannot be said for the region’s Professional & Technical Services sector. Growth since 2020 has not kept up with the nation’s growth rate. Its location quotient declined from 1.51 in 2020 to 1.38 in 2023; continuing a decline that started in 2015, when our region had 1.64 times as many Professional & Technical Services jobs as the nation.
Figure 2
Location Quotient by Industry, Southeast Michigan

Income
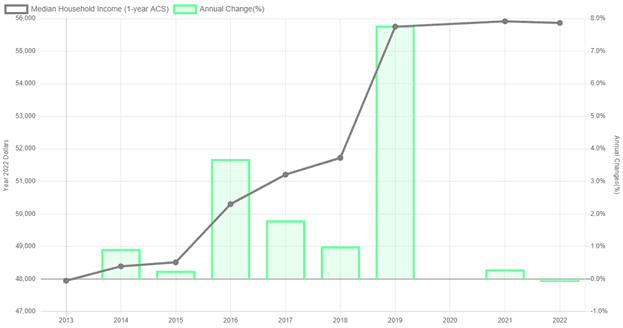
Let’s switch gears and look at some income data at the county level, Wayne County specifically. Figure 3 shows the real median household income and annual percent change for the county. Median household income is perhaps the best measure as to whether a region’s (or county’s) population is becoming more prosperous. Real median income growth has plateaued for the county’s residents since 2019, growing 0.3% in 2021 and declining 0.1% in 2022 (“real” meaning dollar values have been adjusted for inflation).
Figure 3
Real Median Household Income and Annual Percent Change, Wayne County

So why could this be? One possibility is that the COVID-related economic impact payments and advance child tax credits from the federal government ended in 2022. However, these were limited disbursements and the Census Bureau asks respondents to only report income received on a regular basis (e.g., earnings, retirement benefits, Social Security, etc.). So, while it’s possible that some respondents reported these stimulus payments as income, I suspect most did not.
Earnings
Next, let’s take a look at the largest source of household income – which is earnings. Figure 4 shows Wayne County’s real median earnings and annual percent change. Between 2019 and 2021, real median earnings rose from $35,462 to $38,289 for a gain of 8%. Real median earnings rose again between 2021 and 2022 from $38,289 to $39,094 for gain of 2.1%. This robust growth suggests that earnings are not the reason why median household income is flat; therefore, it is likely that other income sources fell with respect to inflation. There are many other sources of income that households receive on a regular basis, but two of these sources are Social Security payments and retirement income.
Figure 4
Real Median Earnings and Annual Percent Change, Wayne County

Now Social Security and some pensions have cost-of-living adjustments, but those are usually applied the year after the observed inflation rates. For example, Social Security’s cost-of-living adjustment (COLA) for 2024 is based on the year 2023’s observed inflation rate. In these last few years, the observed COLAs were 1.6% for 2019, 1.3% for 2020, 5.9% for 2021, 8.7% for 2022, and 3.2% for 2023; setting the applied COLAs at: 1.6% for 2020, 1.3% for 2021, 5.9% for 2022, and 8.7% for 2023.
Table 1 shows how, when these adjustments are aligned with each year they are applied, then the county’s struggle to grow real median household income makes sense. Inflation was greater in 2021 and 2022 than the Social Security COLAs for each of those years. Growth in earnings was really what kept real median household incomes stable.
Table 1
Comparison of Wayne County’s Real Median Household Income Growth, Inflation Rate, and Social Security Cost-of-Living Adjustment
| Year | Real Median Household Income Growth | Inflation Rate | Social Security COLA |
| 2019 | n/a | 1.6% | n/a |
| 2020 | n/a | 1.3% | 1.6% |
| 2021 | 0.3% | 5.9% | 1.3% |
| 2022 | -0.1% | 8.7% | 5.9% |
| 2023 | Not published yet | 3.2% | 8.7% |
For 2023, I am expecting greater growth in real median household income. As you can see in Table 1, the inflation rate is lower than the Social Security COLA (3.2% vs 8.7%). Considering that earnings will likely grow due to the strong labor market, this sets the stage for real median household incomes to resume an upwards trajectory.
I hope these analyses have sparked ideas for how you can make use of our updated Economic Indicators. I’m eager to hear about your experiences with them. Please feel free to share!

Leave a Reply