
Earlier this summer, I began my year-long internship for SEMCOG’s Environment and Infrastructure Planning Department. Being a graduate student, I appreciate my position’s flexibility, which allows me to dabble in various planning specialties and topics. My first tasks and assignments have surrounded getting to know SEMCOG’s data and resources and how our regional analysis can support local planning.
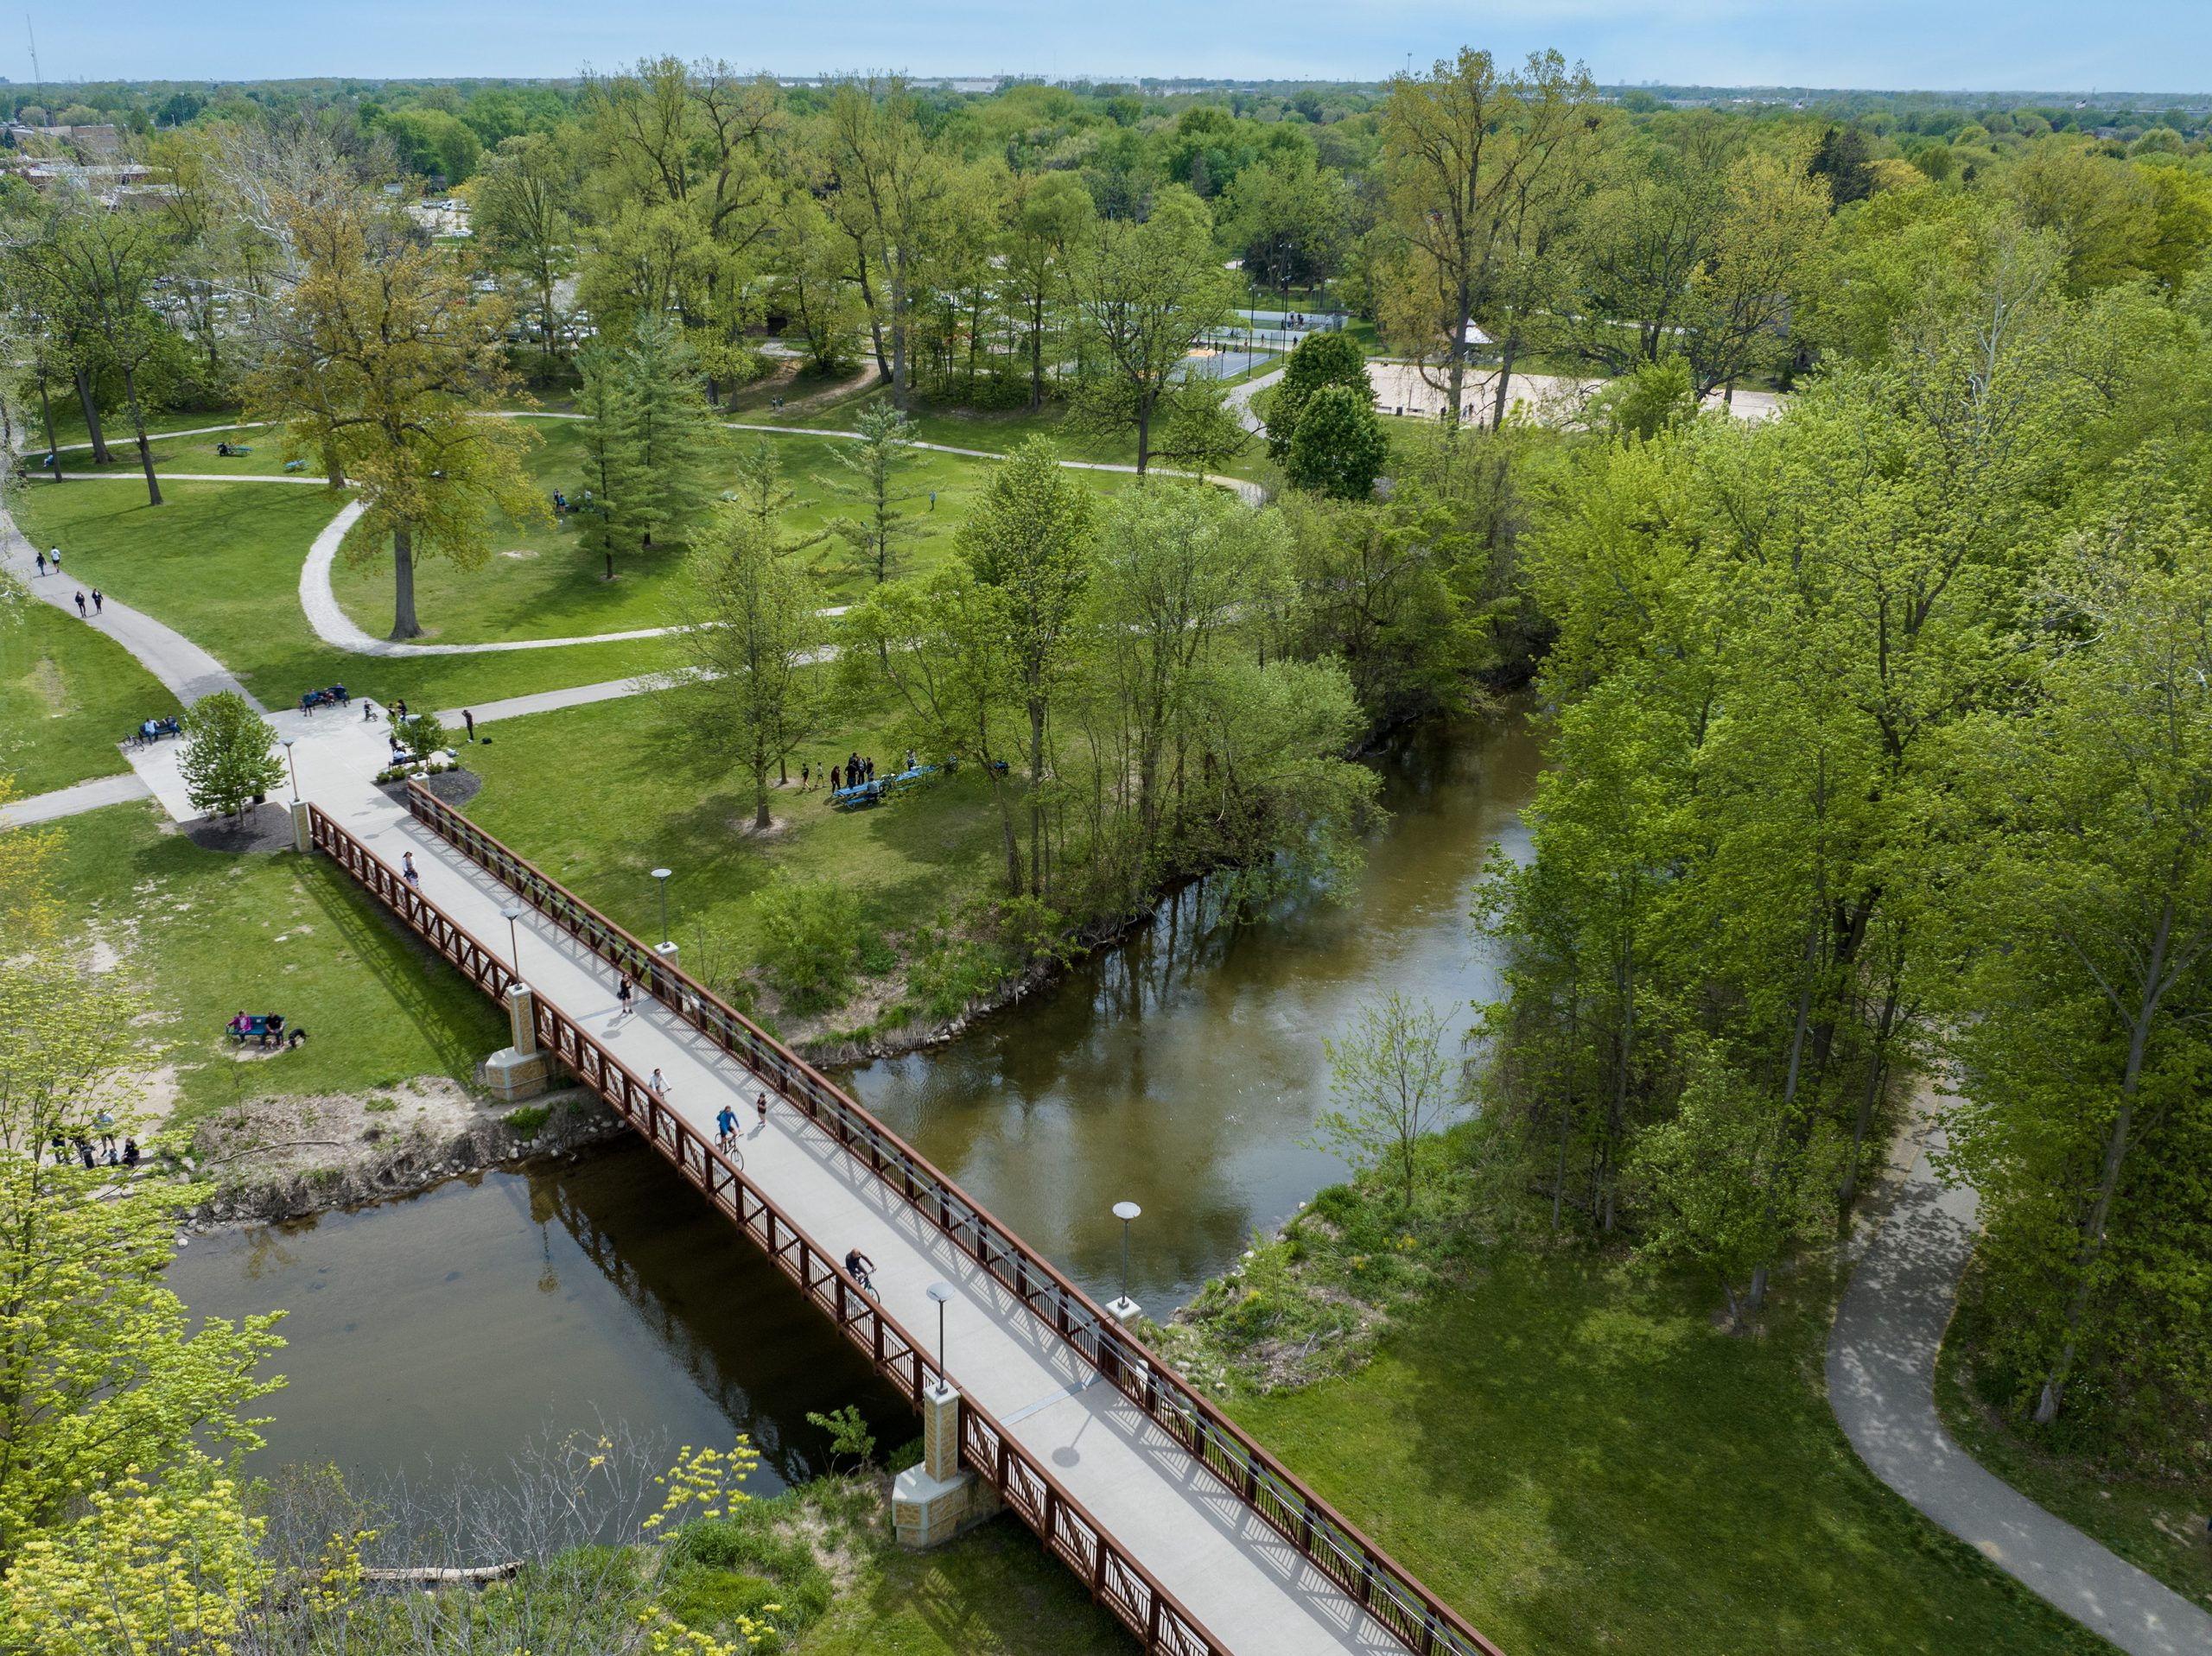
Above: Dodge Park, Sterling Heights
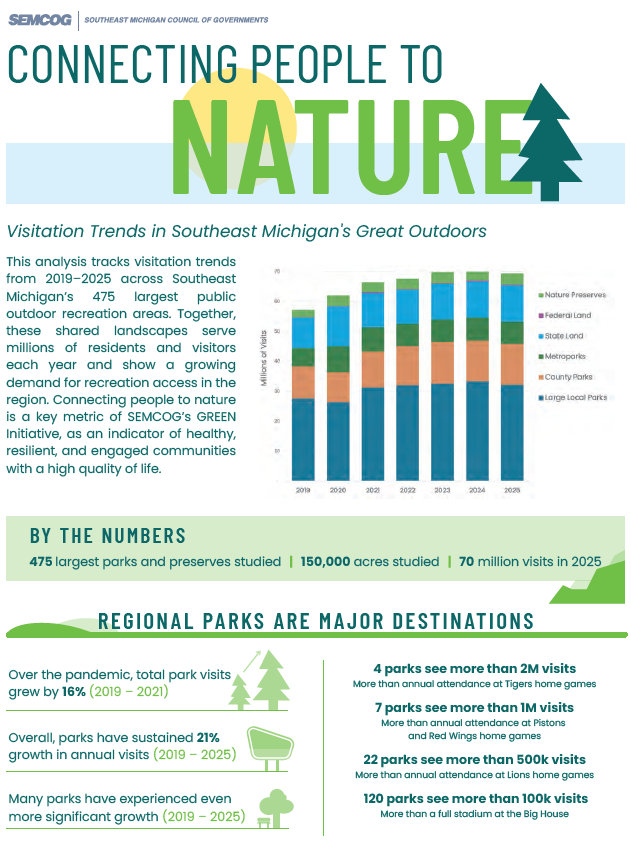
Through a recent project, we’ve taken a closer look at visitation patterns and trends in our largest parks and natural landscapes. We are working to help answer questions like: How many people visit our parks? How has that changed over time? How far away are visitors coming from? How do different types of spaces compare?
Key Findings
Our findings painted a broad, clear narrative of the region. Many are aware that parks experienced a rise in foot traffic during the COVID-19 pandemic, but I was pleasantly surprised to see this trend continue. As of 2025, Southeast Michigan’s parks are continuing to see a yearly increase in overall visitation!
Other surprising and insightful results include:
- Locals Lead — Despite their smaller size, local parks welcome the most annual visits per capita.
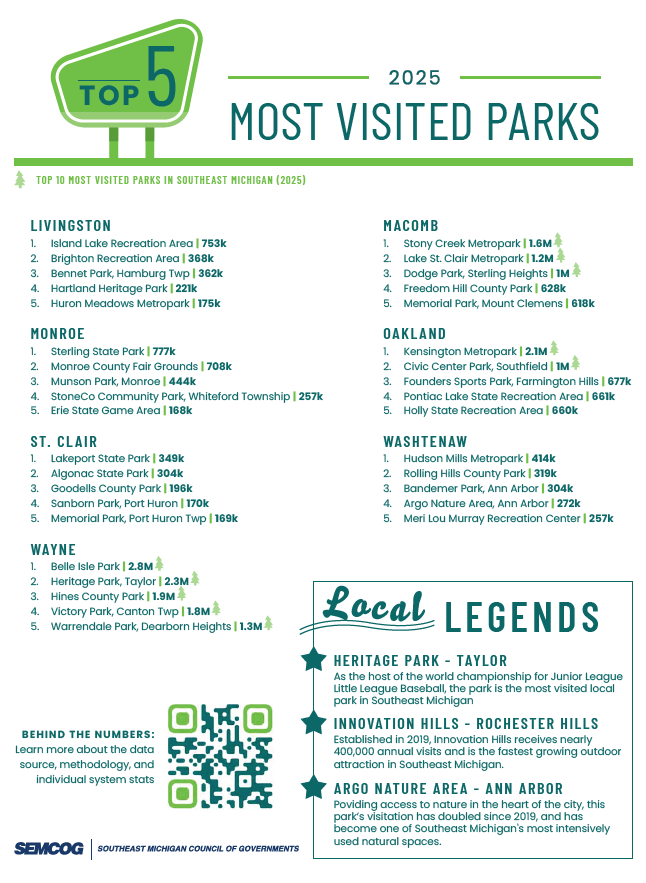
- Regional Refuges — Three Metroparks rank among the region’s top 10 destinations, more than any other single entity.
- National Notice — With new visitor centers opening at the Detroit River International Wildlife Refuge and River Raisin National Battlefield, the region’s few federally managed sites show signs of major momentum.
Behind the Numbers
This park visitation data is sourced from Placer.ai, a location analytics platform that gathers data from mobile phones through application activity, interactions with public Wi Fi, and third-party data integration. While the platform is not intended to provide precise visitation numbers, it does highlight trends, growth, and relative popularity.
The findings from this analysis can be used to analyze broad concepts, compare findings across park spaces and communities, and serve as a basis for otherwise “unanswerable” questions within our parks and recreation network. Learn more about the data source, methodology, and individual system stats.
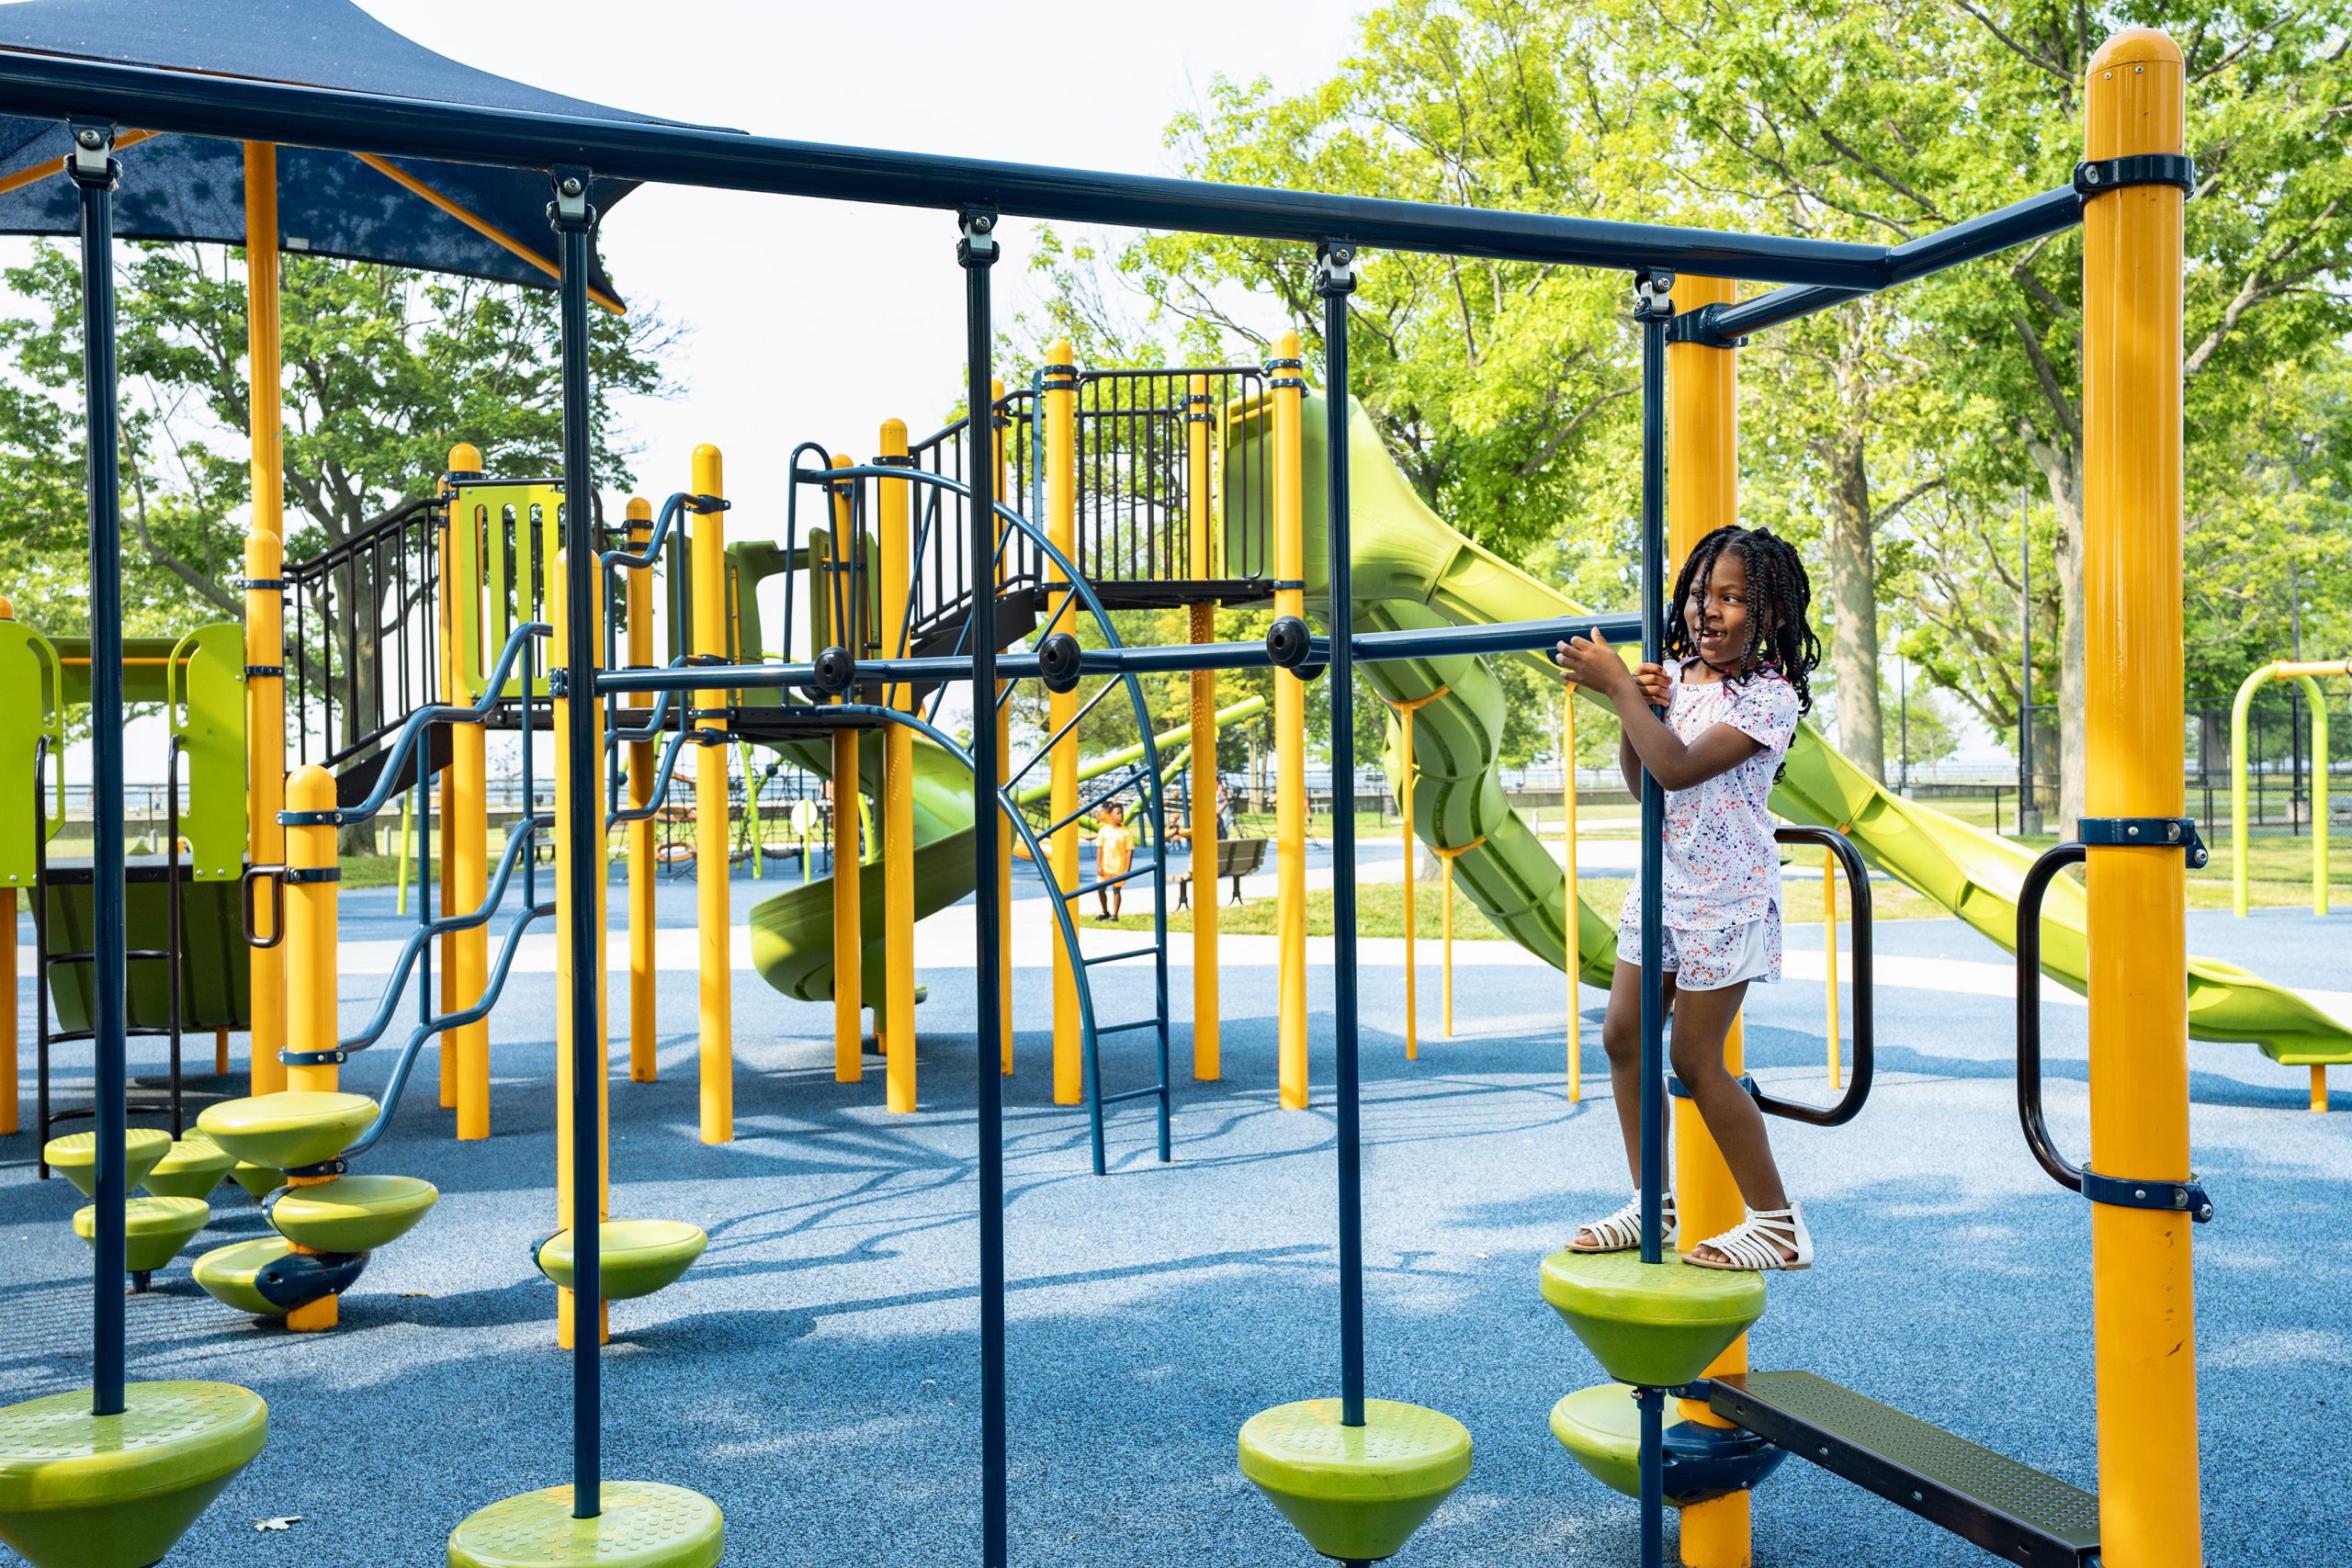
Above: Playground at St. Clair Metropark
What’s Next?
We’re planning to expand our sights to all public parks larger than five acres. We hope to release more reporting and interactive tools, and please reach out if you are interested in specified data about your community’s parks.
Leave a Reply