As SEMCOG’s Bicycle and Pedestrian Planner, I get the privilege of working with communities in their efforts to become more walkable and bikeable. These are the two most common questions I’m asked when meeting with communities – What can they do to increase walking and biking for their residents? And, is there a map of all the region’s existing infrastructure?
Good news! SEMCOG’s new Bicycle and Pedestrian Mobility Network Map not only answers both of these questions. But, also provides communities with multiple tools to plan for and coordinate with their neighbors to enhance the region’s mobility. Through this new intuitive and interactive map, users can view the bicycle and pedestrian network via five different tabs, focusing on what’s most important to them. But first things first, let’s make sure we’re using the same lingo.
Brian provides an overview of the map in this short video.
When you first visit the map, you’ll want to check out the “About this Map” tab. This is where you can get pictures and definitions for biking and walking improvements. You’ll learn exactly what makes up our bikeway, pedestrian, and trail networks, as well as how to use these maps to better plan your local network. So, let’s look the maps!

Existing Bikeways
The next tab is the Existing Bikeways Network, which consists of shared-use paths, bike lanes, and other bikeways – things like rural wide-paved shoulders, bike routes, and shared-lane markings. For each of the bikeways, you can click on the map and get more information.


Here is an example of a shared-use path along Fieldcrest in Green Oak Township. Note that the path is 8 feet wide and a Tier 1 comfort level, which means comfortable for most people.

If we click on one of the Bike Lanes – identified as blue on the map, like this one along Cass Avenue in Detroit – we discover that it’s a protected bike lane.
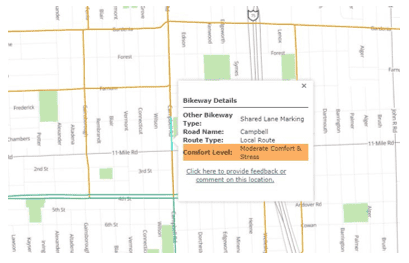
If we click on an “other bikeway” along Campbell Road in Royal Oak, we see that it is a shared-lane marking and part of the city’s local bike routing network.
Together, these individual treatments create a network of bicycle infrastructure and facilities, which also show us where gaps exist. Such mapping can be very useful both for local bicycle and pedestrian planning efforts, as well as for supporting documentation for grant applications.

In the example above, we can see a gap along Grosse Ile Parkway, between two shared-use paths.
Existing Pedestrian Network

In the third tab, we visually display the network from a pedestrian perspective. This map features more than 24,000 miles of sidewalks, shared-use paths, as well as marked and unmarked crosswalks. At a region or county level, it’s very impressive to see how much of our urbanized area has sidewalks.
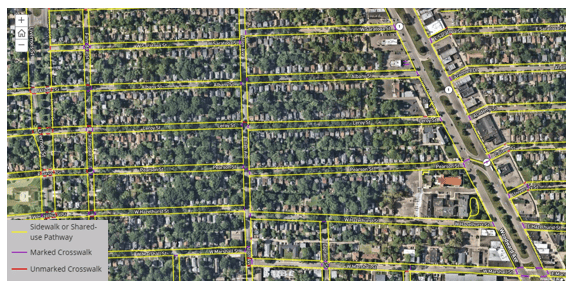
As we zoom in, note the very precise locations of the sidewalks along roadways and through parks and other public spaces. You can easily see on which side of the road the sidewalk is located.
Where sidewalks are bisected by a roadway, we have our crosswalks. There are two types of crosswalks: marked/painted ones shown in purple and those that are unmarked, but provide legal crossing, shown in red.
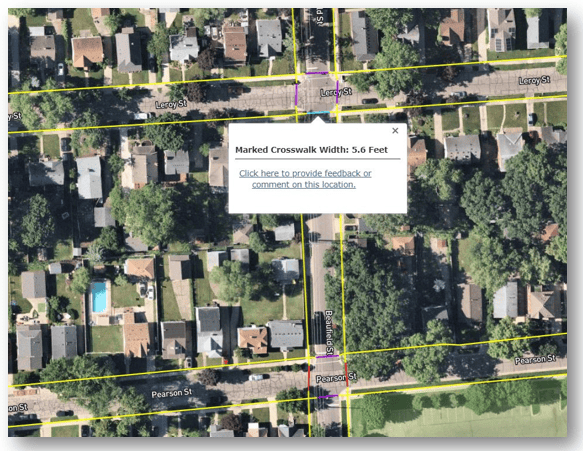
For any sidewalk or crosswalk, click on the segment to get its width.
This data is useful for planning at both the local and regional levels to identify gaps in the network and to understand how accessible destinations are for those who walk. Our hope is that communities can use this data as a starting point for creating or enhancing their sidewalk networks, as well as updating condition inventories and American’s with Disabilities (ADA) transition plans. It can also be very useful for Safe Routes to School applications.
We are continually updating and improving this data and are asking for feedback from communities and local stakeholders. As such, every tab in the mobility map, includes a “feedback” link that sends an email directly to SEMCOG for improvements or requested edits.
Regional Trail Network

Another way to visualize the network is via regional trails. These are the major linear shared-use pathways that provide connections between and across communities and counties. Each of these likely has a name, as well as branding and way-finding signage associated with them. They are generally viewed as destinations for both residents and visitors. Think the Paint Creek or Polly Ann Trails in Oakland County, Hines Parkway in Wayne County, or the Wadhams to Avoca Trail in St Clair County. Many communities are engaging in “trail town” planning efforts to meet the needs of people interested in using these trails to walk or bike long distances. SEMCOG is helping this effort with its Southeast Michigan Trail Explorer.

The Blue Water River Walk and Bridge to Bay Trails are examples of regional trails.
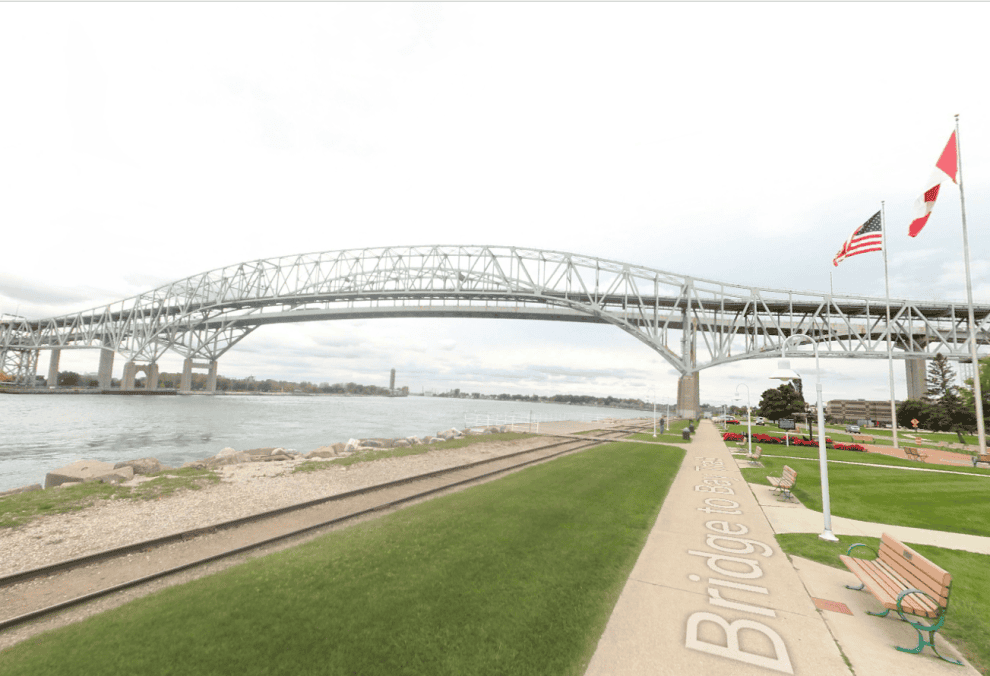
Sometimes these trails have gaps between trail sections. In these cases, communities have designated Regional Trail Routes that provide needed connectivity between trail sections, but don’t meet the anecdotal gold standard for a trail (shared-use paths). Many communities are looking to upgrade these “trail routes” to trails over time.

In Gibraltar, the Downriver Linked Greenways transitions between a shared-use path “trail” and a sidewalk that acts as the “trail route.”
This map also includes our statewide trail initiatives – the Great Lake to Lake Trail, highlighted in blue, and the Iron Belle Trail in yellow. This map will be very helpful for communities who are looking to show how their local improvement fits into regional trail connectivity – either directly filling a regional gap or providing greater connectivity via a spur.
Planned Bikeways and Pedestrian Network
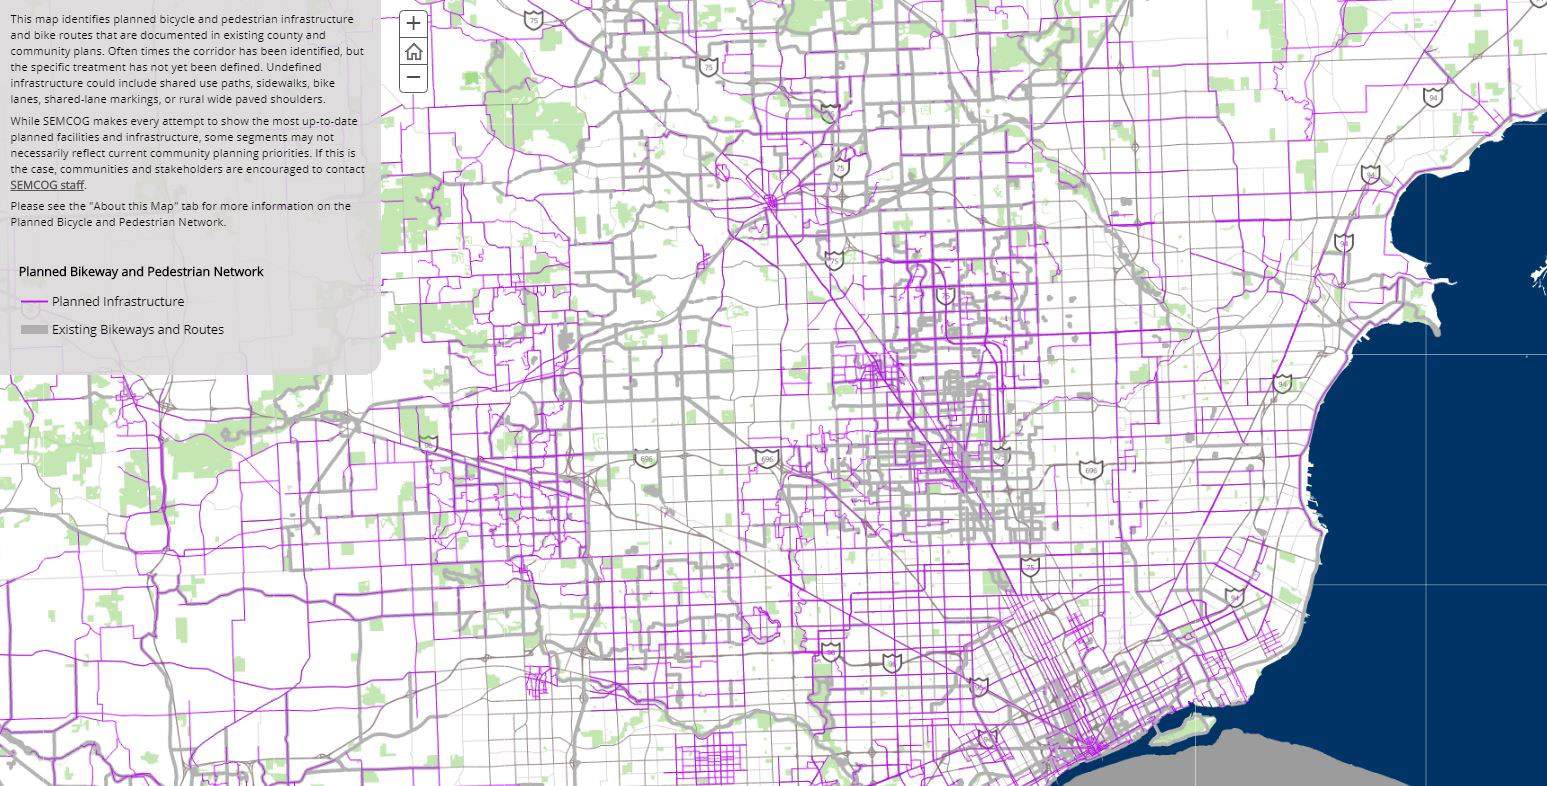
Additionally, users can visualize the entire planned bikeway and pedestrian network, via the fourth tab. This map is built off of community, county, and road agency plans, and displays locations of planned biking or pedestrian facilities across the region.

For example, if we zoom into Northville, we see that a shared-use path is planned along 5 Mile Road. This would connect to existing infrastructure shown in dark grey and connects directly to the Hines Park Bikeway to the east. Bicycling Comfort Level
SEMCOG also has tools to assist communities in building bike routes that better accommodate people of all ages and abilities, especially beginner bicyclists.
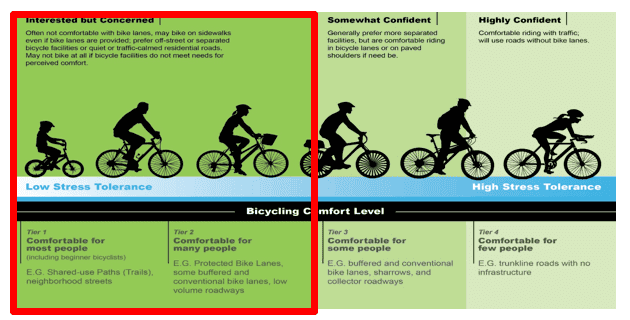
SEMCOG’s Bicycling Comfort Level Tool shows where people may feel the most comfortable riding their bike, even if there is no dedicated bicycling infrastructure.
Roads are divided into four tiers of comfort. Users can click on a road for more information, including speed limit and traffic volumes.

For example, when I click on Grove Road, I see that it’s part of the Border-to-Border and Iron Belle Trail. It’s also a Tier II roadway that is likely comfortable for many people, with a speed limit of 25 miles per hour, and an average daily traffic volume of 2,000.
If I click on Ecorse Road, I learn that it’s likely a less comfortable bike ride at a Tier III. If we want to get people from the Border-to-Border to a destination on the east side of town and do so with the highest amount of comfort. We can use this information to either upgrade a facility on Ecorse Road or select a parallel street that may already be more comfortable. A community may want include way-finding signage for the parallel roadway which then becomes a low-stress, easily implementable bike route.

Example of way-finding signage that could be on a low-stress bike route.
This map is live today and all the data is available via SEMCOG’s Open Data portal. Feel free to reach out to me if you have questions or comments. Also feel free to contact me about scheduling some technical assistance for your community or details about the upcoming Transportation Alternatives Program (TAP) application deadline. P.S. The deadline is October 16!
Together, we can make Southeast Michigan more walkable and bikeable!
Reach me at [email protected] or 313-324-3426.

Leave a Reply