SEMCOG has started development of the 2055 Regional Forecast, which provides a thirty-year analysis of population, employment, housing, and land use change for each community in the Southeast Michigan region. The forecast is a key component in developing the 2055 Long-Range Transportation Plan and supports regional and local planning in the areas of transportation, air and water quality, and community and economic development. Moreover, counties, communities, and school districts in the region use the forecast in planning their future infrastructure and development needs. According to Canton Township Supervisor Anne Marie Graham-Hudak, “You always have to be remaking and moving forward with your community”, adding “SEMCOG’s data definitely helps because it shows us what the trends are in employment and housing and land use change.”
What is the Regional Development Forecast?
Every four to five years SEMCOG develops a new long-range forecast of demographic and economic change. This forecast extends thirty years into the future and measures changes in several key indicators including population by age, households with children, housing construction, and employment by economic sector. The forecast measures these changes, in five-year increments, for each unit of local government, including counties, cities, townships, villages, and school districts. For more detailed transportation planning, small area forecasts are developed for transportation analysis zones, similar in number and size to census tracts.
SEMCOG utilizes state of the practice computer modeling to produce the regional development forecast. Regional and county forecast results are produced in partnership with the Michigan Department of Transportation and the University of Michigan, using the national REMI economic equilibrium model. For sub-county forecast results, SEMCOG uses the UrbanSim microsimulation model, a regional land use model that simulates future real estate development based on local land use policies, planned future development, historical development patterns and expert staff analysis of household and business location decisions. Experts from across the region, including local elected officials, academia and business leaders, contribute by reviewing the forecast as it is being produced.
SEMCOG Forecast Provides Solid Basis for Local Planning
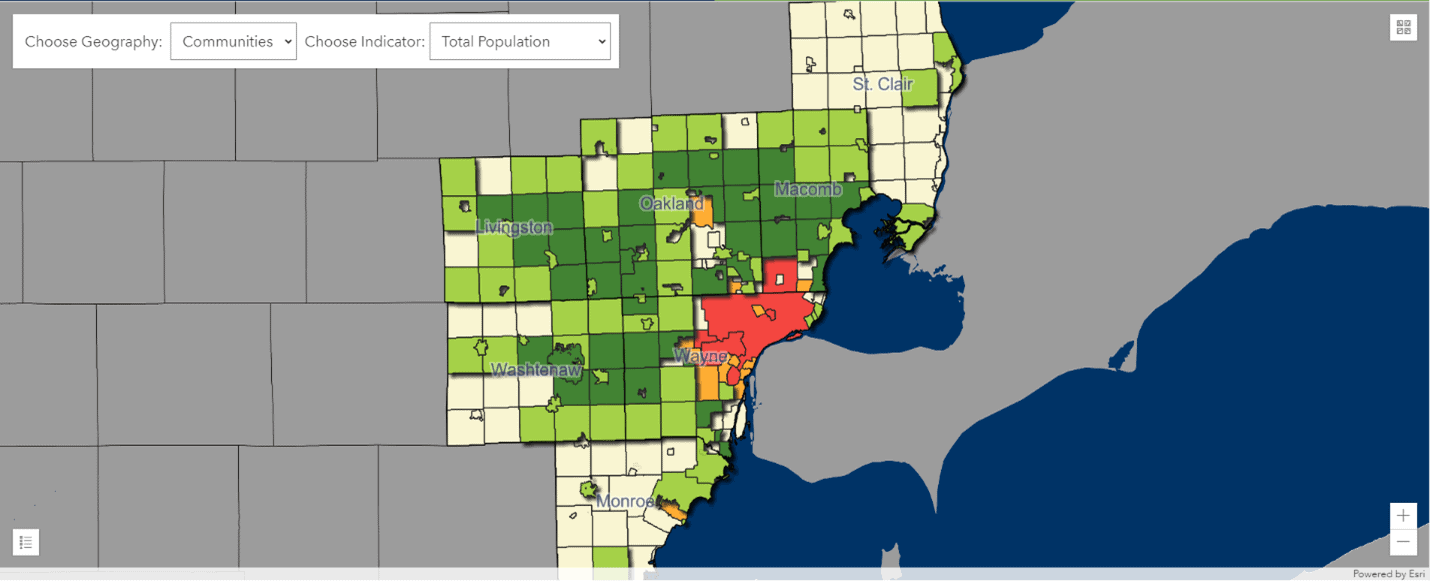
Understanding future shifts in population dynamics, or changes to our regional economic structure, helps planners determine the region’s long-term housing and infrastructure needs. Knowing both when and where households and jobs will locate in the future improves infrastructure planning by allowing stakeholders to work together to plan needed improvements in a coordinated and efficient manner. SEMCOG’s 2050 Regional Forecast Explorer, highlighted below, shows the long-range projections for every community in the region from the most recent forecast, adopted in March 2023. This tool is a valuable resource for demographic and economic data that supports development of community master plans.
SEMCOG 2050 Regional Forecast Explorer

In addition to the actual Regional Development Forecast results, SEMCOG develops many data layers as input into the forecast that also serve as high quality data, valuable for local planning. These data sets include our recently updated inventory of buildings in the region – now current as of December 2024; SEMCOG’s Residential Construction story map; and annual estimates of population and households by community.
Evaluating Economic Scenarios Helps the Region Plan for Future Change
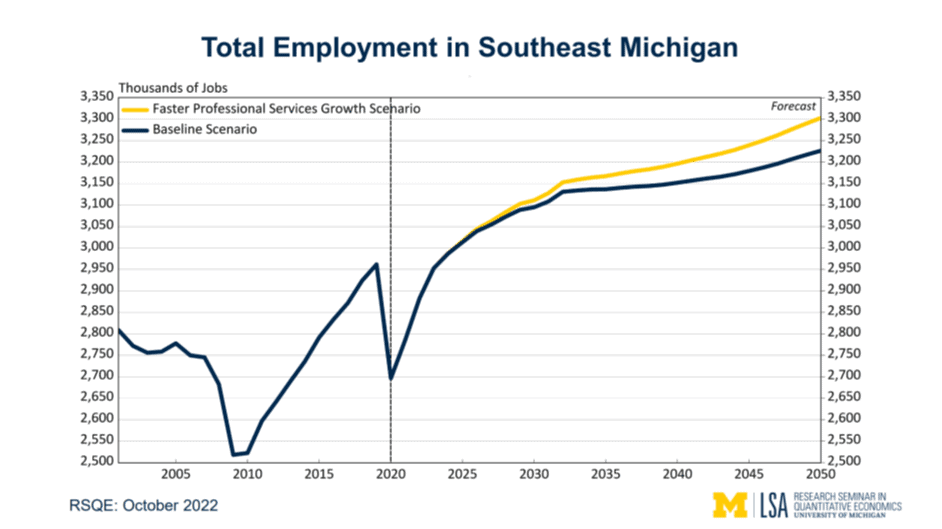
In an era of rapid economic change, evaluating alternative future scenarios is critical to understanding how our region may transform over time. What would happen if the Southeast Michigan economy were to further diversify? How will changes in vehicle preferences or supply chains affect the automotive industry over time? Do changing migration patterns influence our economic outlook? SEMCOG works with regional stakeholders to identify potential economic outcomes and model these changes over time, producing multiple alternative forecasts for policy consideration.
2050 Regional Forecast – Faster Professional Services Growth Scenario

Your Local Data Drives the Forecast
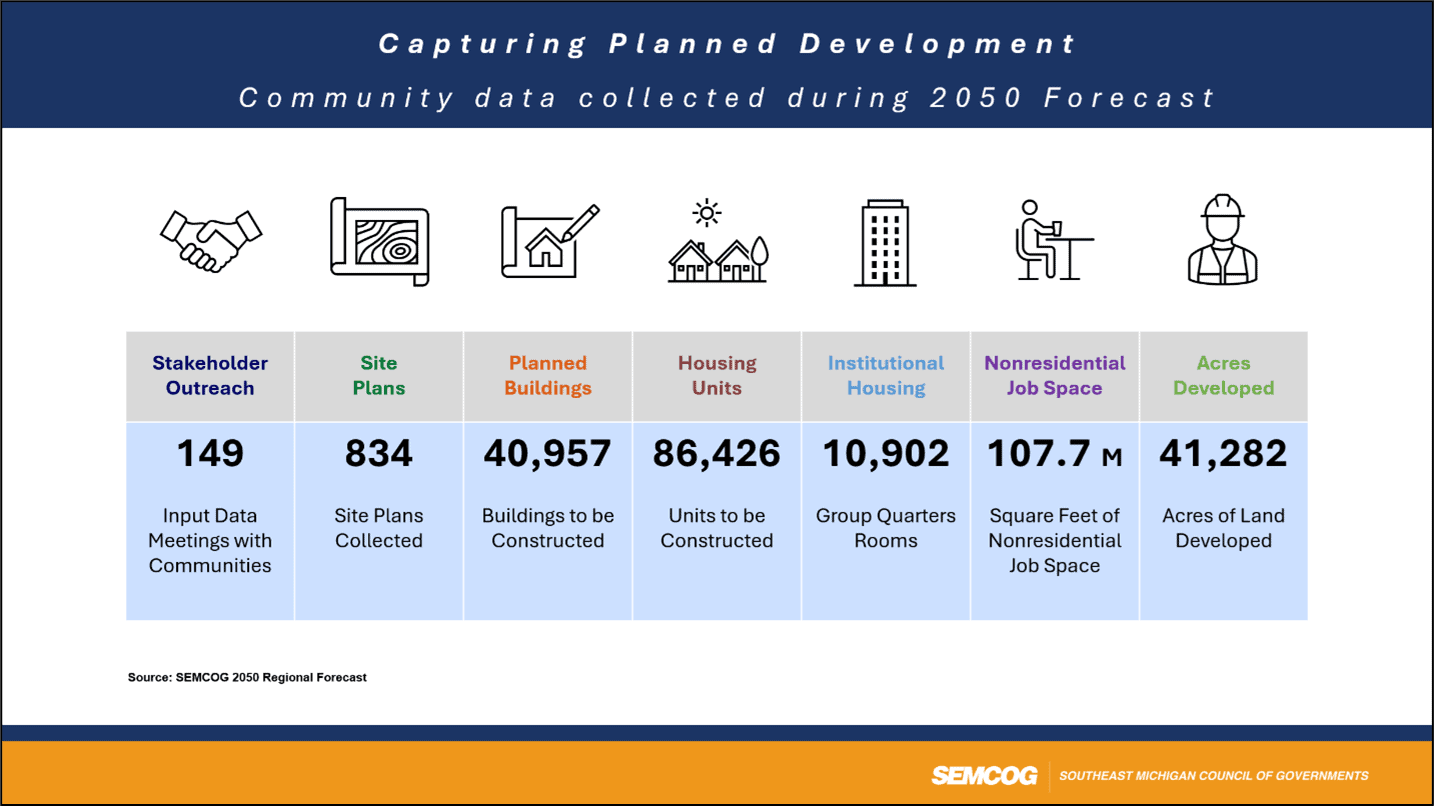
To produce the most accurate forecast results, SEMCOG needs the best possible information on future development trends in each community. Planned housing and nonresidential development projects are a direct input to the forecast and the primary driver of change in forecast results over time. Supervisor Graham-Hudak notes, “Each community has its own personality. We want to make sure there is a good transition from each community to the next one.”
SEMCOG staff will be reaching out to each community in Southeast Michigan in the coming months to arrange an opportunity to sit down together and ensure we use your latest development information in the 2055 Regional Forecast.
2050 Regional Forecast – Planned Development Data Collected

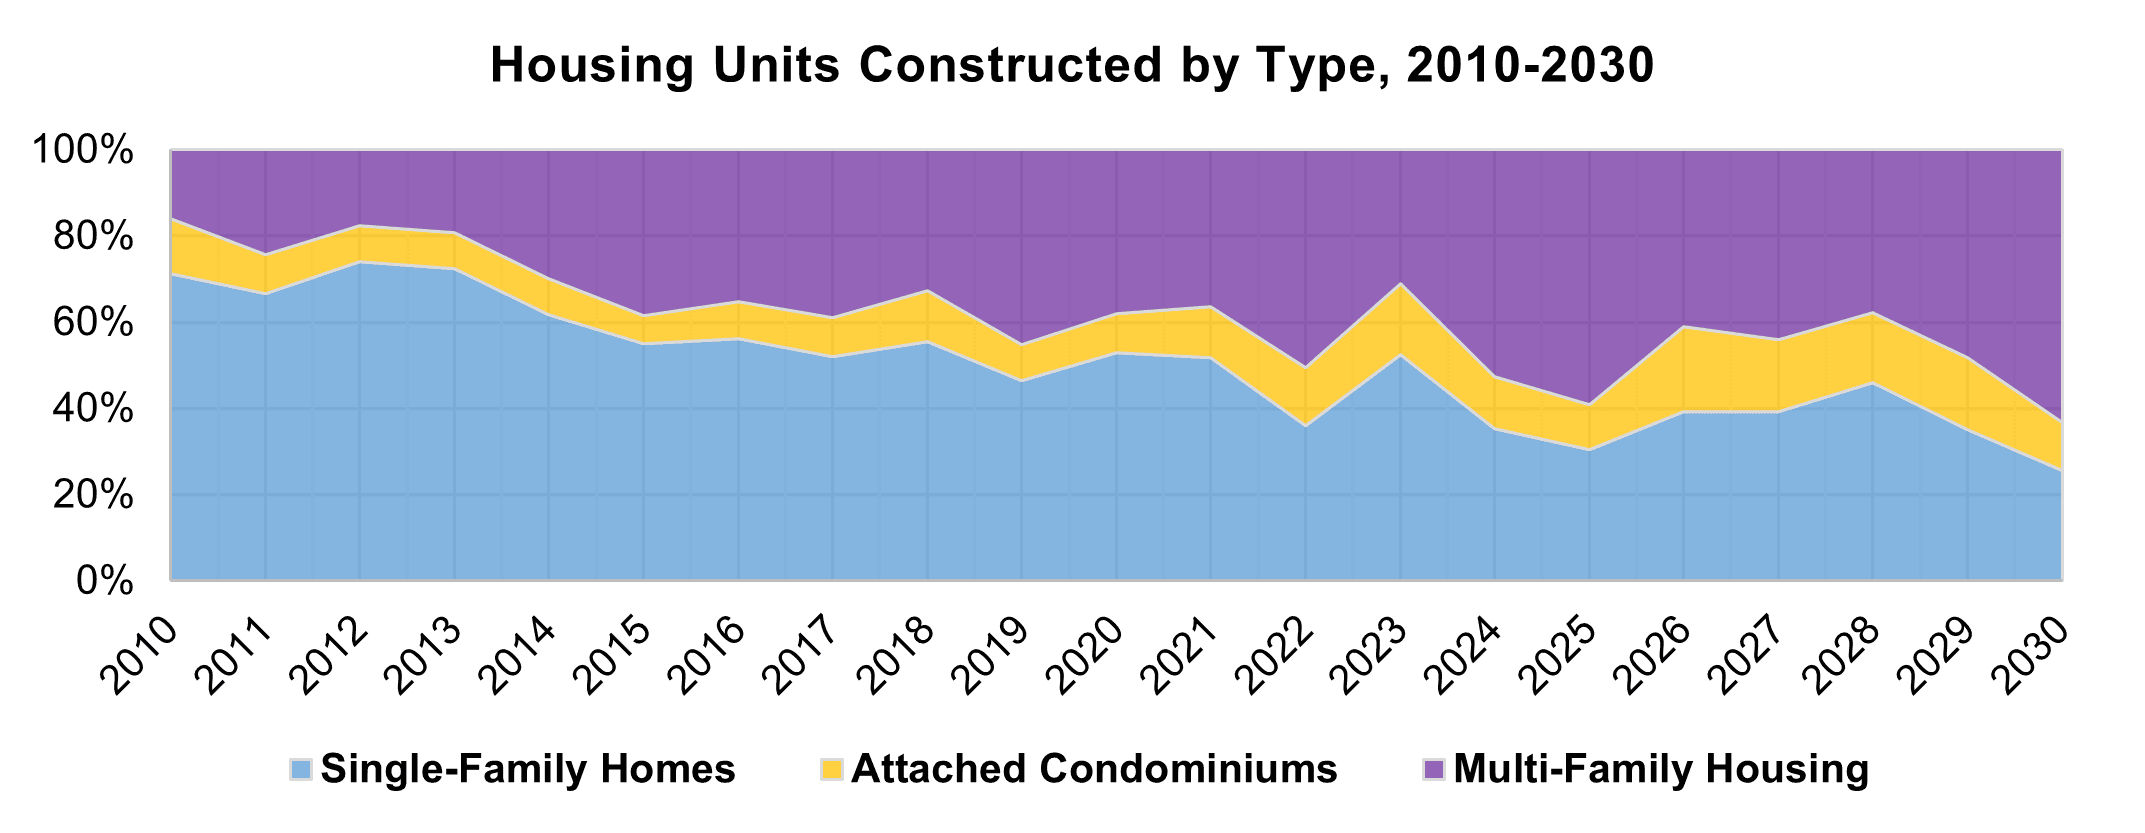
Future development plans can also provide insights into how the region’s development pattern is changing. For example, an analysis of approved development plans collected from communities during the previous forecast revealed a shift towards construction of multi-family housing units in the near future, unprecedented in recent years.

Source: SEMCOG, 2050 Regional Forecast.

Leave a Reply