
SEMCOG’s Shared Prosperity application provides an overview of how economic gains and losses are distributed geographically and by socio-economic groups. This application examines how household income growth changes over time, by income group, across different Southeast Michigan counties. It answers the question whether all income groups, especially the middle class, are realizing prosperity.
To begin, let’s review our region’s Real Median Household Income for 2018-2024 (Figure 1).
Figure 1: Real Median Household Income, 2018-2024
Detroit-Warren-Dearborn MSA
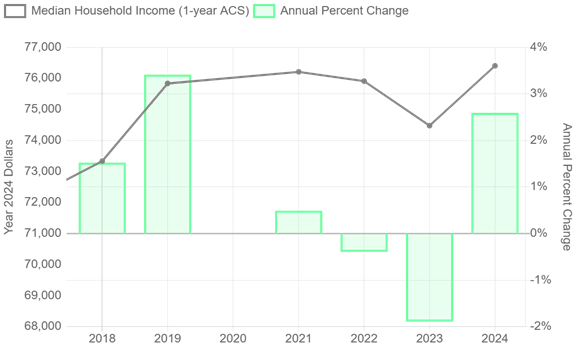
Source: U.S. Census Bureau, American Community Survey 1-year Estimate (year 2020 data is not available)
Real median household income is one of the best measures of income growth for our region because:
- It is adjusted for inflation (i.e., it is real as opposed to nominal)
- It is the middle-value of all reported incomes in the annual American Community Survey (i.e., it is the median)
Despite these strengths, real median income does not tell us how incomes are changing among the lower, middle, and higher income groups. Nor does it account for household size or local cost of living. Shared Prosperity, on the other hand, does provide the opportunity to account for such distinctions.
To create the Shared Prosperity data, we calculate the median income from the 1-year American Community Survey Public Use Microdata Sample (ACS PUMS) but adjust it for inflation and by household size, turning it into three-person household equivalents. (Three-person household equivalents were chosen to reduce classification bias, as single-person households tend to be over-classified as lower income and large households tend to be over-classified as higher income.)
We also adjust for local cost of living; after all, a household living on $100,000 in Detroit has different purchasing power than a household living on $100,000 in New York City.
Once the median incomes are calculated by household size and local costs of living, we then apply the income group definitions. The income groups are defined as:
- Lower income: less than 2/3 of the median income
- Lower-middle income: between 2/3 of the median income and the median income
- Upper-middle income: between the median income and 2 times the median income
- Higher income: greater than 2 times the median income
Once the income groups are set, we can analyze the data. The household incomes within each group are averaged for each year. We then calculate the percentage change between the two years to measure the real income growth rate (Table 1).
Table 1: Real Income Growth Rates, 2018-2024
Southeast Michigan
| Household Income Group | Average Income, 2018 (2024 $) | Average Income, 2024 | Real Income Growth |
| All | $120,873 | $125,598 | 3.9% |
| Lower Income | $31,285 | $33,623 | 7.5% |
| Lower-Middle Income | $73,794 | $80,672 | 9.3% |
| Upper-Middle Income | $126,817 | $136,770 | 7.8% |
| Higher Income | $299,699 | $336,786 | 12.4% |
Source: SEMCOG.
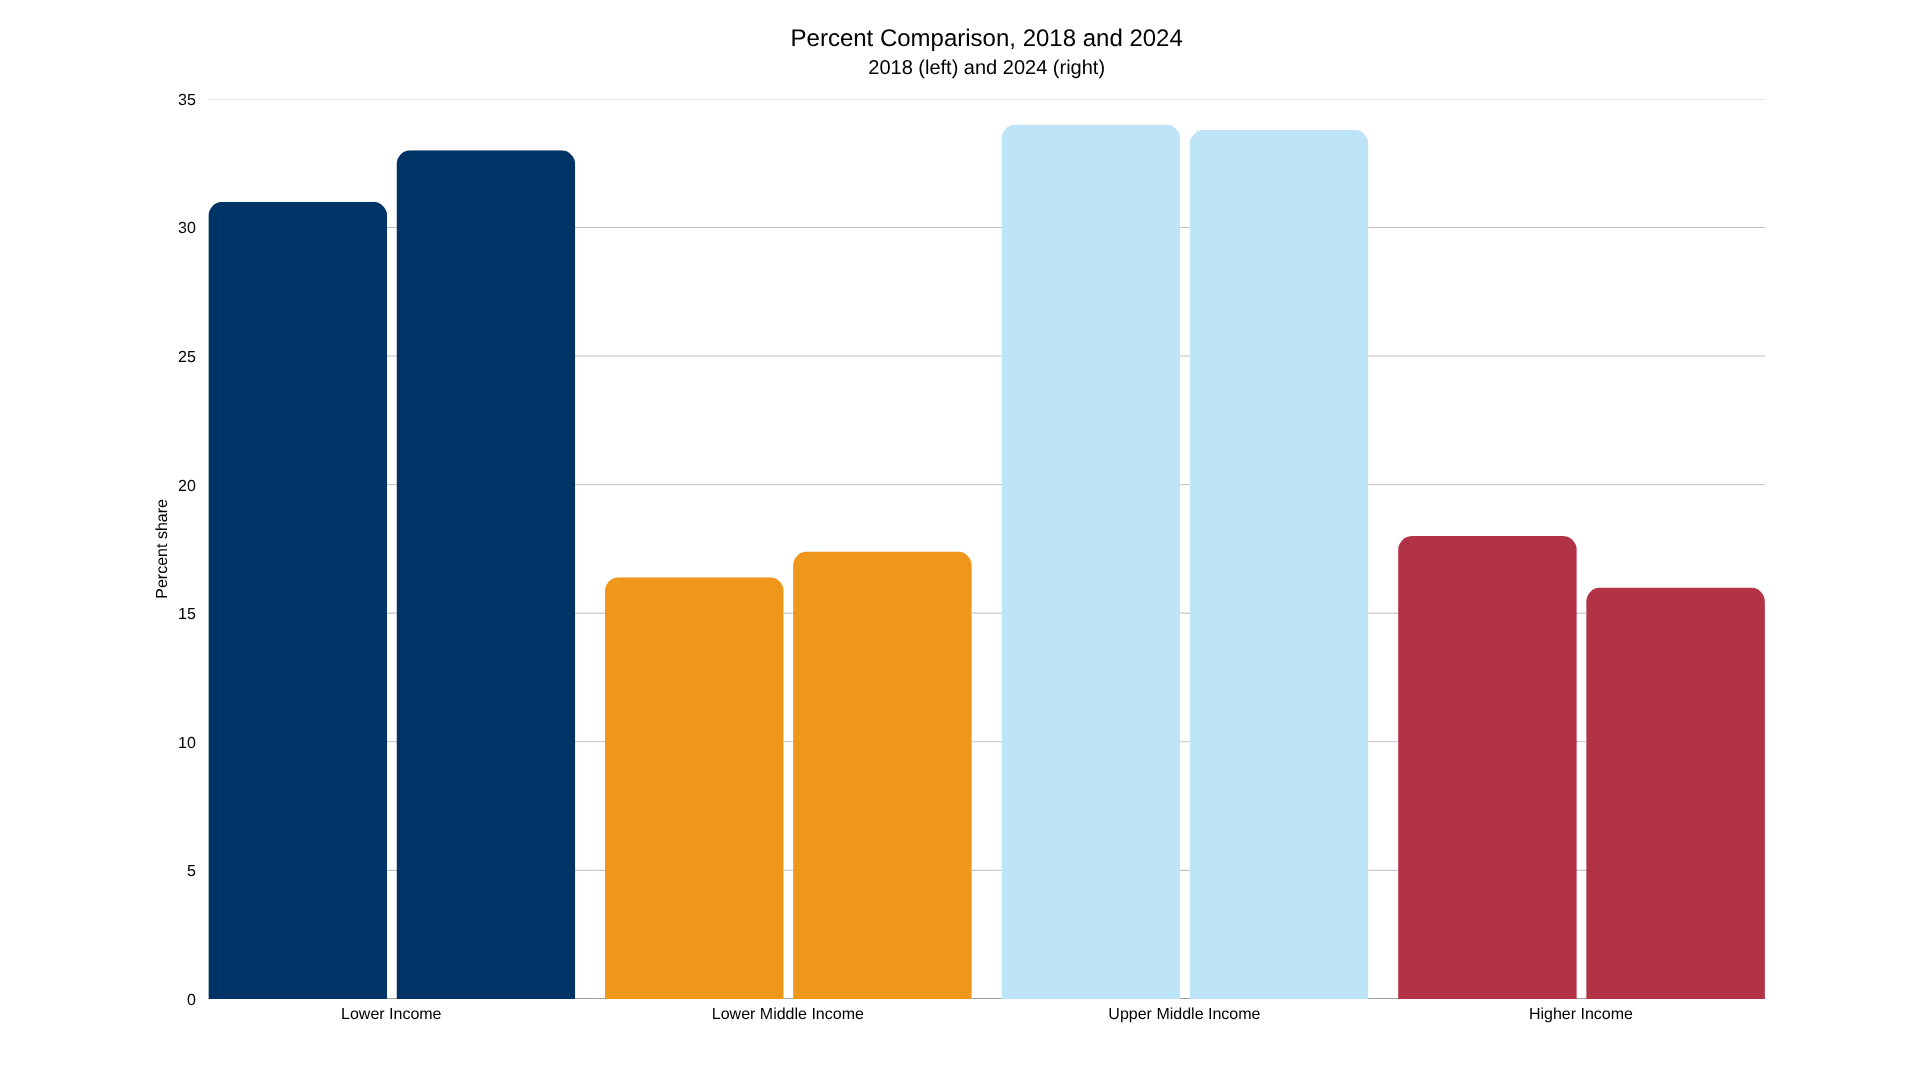
Often the real income growth rates for each income group will not align with the overall real income growth rate; growth rates for all four income groups may exceed the headline growth rate. For example, Southeast Michigan’s overall growth rate between year 2018 and year 2024 is 3.9%, but all four income groups realized real income growth rates of 7.5% or greater. The reason behind such differences can be explained by the Share of Population chart (Figure 2).
Figure 2: Share of Population, 2018 and 2024
Southeast Michigan
Source: SEMCOG.
Figure 2 shows how the shift in population shares influence the overall real income growth rate. For example, between 2018 and 2024, the share of people in higher income (red) declined from 18.6% to 16.1%, while the share of people in lower income increased from 30.7% to 32.5% (dark blue) and lower-middle income increased from 16.6% to 17.5% (gold).
SEMCOG has Shared Prosperity data for all seven counties, the region, Michigan and the United States. Data can be broken down into two socio-economic groups – disability status and educational attainment – we intend to add more socio-economic groups in the future, including age group, race/ethnicity, and employment status. SEMCOG also published a Shared Prosperity QuickFacts with a summary of our findings at the regional level for years 2018-2024. This application is based on research reports developed for us in 2020 and 2024 by University of Michigan’s Research Seminar in Quantitative Economics (RSQE).
Join our Mailing Lists
All of SEMCOG’s email lists are now managed in one place. You can go to your profile at any time to update your preferences and choose the information you want to receive—whether it’s Regional Updates, Legislative Updates, Public Notices, or other topics. Stay in the loop on topics that matter most to you.
Join our mailing lists
Leave a Reply