Photo: Hamtramck Labor Day Festival
A version of this article was originally featured in SEMCOG’s Economic Development special edition magazine: What’s Our Edge?. Southeast Michigan’s success depends on the unique strengths of its communities, businesses, and educational institutions. Regional cooperation, data-driven strategies, and a skilled workforce are key to driving growth. The Gordie Howe International Bridge, access to water, and education play vital roles in shaping the region’s future. By aligning these assets, the region can achieve greater prosperity, guided by the Economic Development Council’s new strategy.
For decades, SEMCOG has been a comprehensive resource for local data. This practice expands into the world of economic development with a number of new or updated tools and services. Some of our updated tools include the Socio-Economic Trends where the user can look at annual trends by county (i.e., the Socio-Economic Indicators) or the latest economic trends important to the region (i.e., the High-Frequency Socio-Economic Dashboard).
SEMCOG has developed tools that allow users to understand the socio-economics of each community, for example, Community Profiles and Community Explorer. Our Community Profiles provides the latest socio-economic data on demographics, economics, and housing; while Community Explorer uses this data to provide a comparison to other communities in the region, with maps showing geographic distributions. Both now have the latest 5-year American Community Survey data from 2019-2023.
SEMCOG has several new data resources for our members. The first is our Tracking Change application. This interactive dashboard provides an overview of how our region changed over a set period of time by showing progress across 30 economic and demographic indicators. The current period of time looks at how the region changed since the COVID pandemic (years 2019-2023). The second new resource is our Nonresidential Development application. This is another interactive tool that looks at the latest nonresidential development trends across Southeast Michigan. The data are regularly updated to provide the latest project type, floorspace, construction status, and location of nonresidential construction projects across the region. The third new resource is SEMCOG’s Location Analysis and Visitation Tool. This is a service provided by SEMCOG to assess visitor and foot traffic for parks and recreation assets, downtowns and commercial corridors, and events and festivals. Local government members can request an analysis from SEMCOG.
Southeast Michigan’s Economic Characteristics
Southeast Michigan is a unique, vibrant region that is the center of the world’s automotive and mobility industry. The region is an affordable place to live and has access to vast natural resources used for commerce and recreation.
- 4.77 million people, 47% of the state’s population
- More than 3,000 businesses with over 100 employees
- 22 four-year colleges and universities, 8 community colleges
- 7 counties, 93 cities, 24 villages, 115 townships
- Over 100,000 private-sector businesses that employ over 1.9 million people
- More than 100 businesses with over 1,000 employees
- 200,000 acres of public parks and 100,000 acres of water
- The highest concentration of transportation equipment jobs in the country
- The second-highest concentration of engineers in the country among metro areas with 1 million+ people (after Silicon Valley)
- Detroit and Port Huron are the country’s second- and third-most valuable trade ports with over $250 billion in annual trade
- Established economic clusters in automotive, metalworking technology, and plastics with emerging economic clusters in defense as well as transportation and logistics
Latest Trends
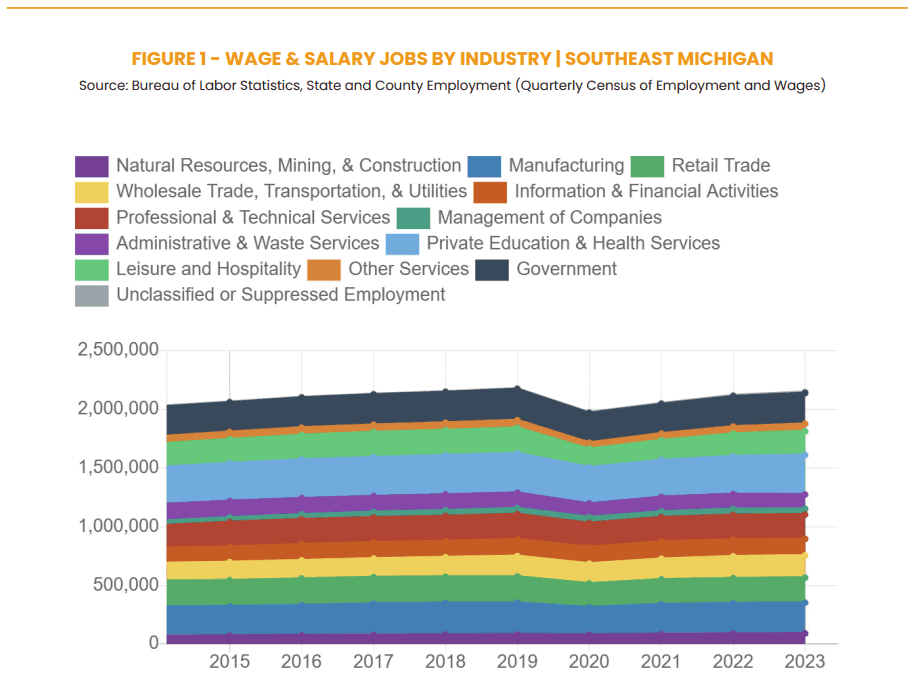
What are the region’s latest trends? Let’s start with the business pillar of our economic development strategy. Total employment growth grew by more than 28,000 jobs or 1.3% in 2023 (Figure 1). Growth varied amongst industry sectors. Private Education and Health Services had the largest numeric growth of 15,000 jobs mostly in the healthcare industry, while Leisure and Hospitality had the largest percentage growth at 5%. At the same time, Administrative and Waste Services had the largest numeric decline of 5,000 jobs, while Management of Companies had the largest percentage decline at 5.2%. Critical export-oriented sectors like Manufacturing, Information and Financial Activities, and Professional and Technical Services saw little change.
Unemployment Rate
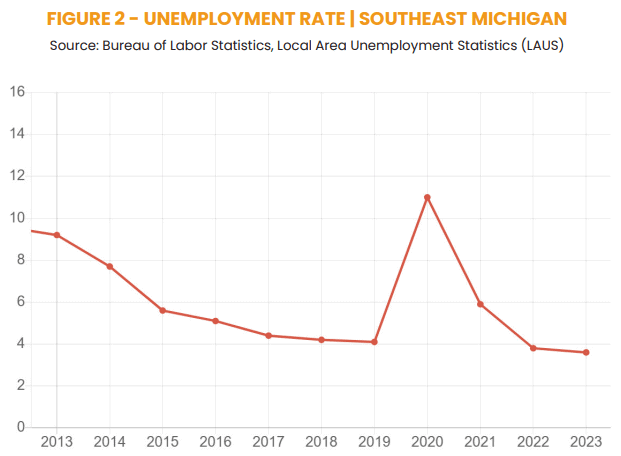
Moving on to talent, the region’s unemployment rate dropped to 3.6% in 2023, its lowest level in the last two decades (Figure 2). Strong labor demand fueled the latest decline in the unemployment rate; for the number of employed people now stands at 2.3 million, or 7,000 more than in 2019.
Labor Force Participation Rates
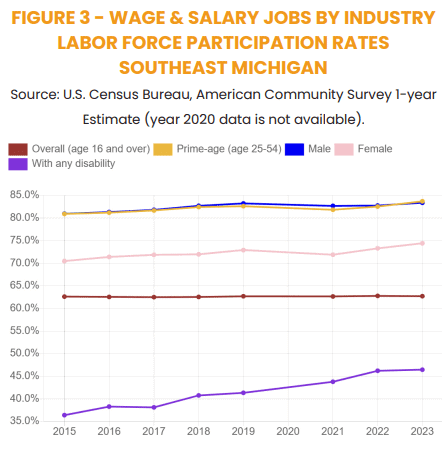
Strong labor demand has also pushed labor force participation rates upwards. The overall labor force participation rate for the region declined by 0.1% in 2023 (due to our aging workforce). The participation rate for the prime workingage population (age 25-54) grew by 1.2%. Female participation increased by 1.1%, while male participation grew by 0.6% (Figure 3). People with a disability increased their participation by 0.2%.
Population Change
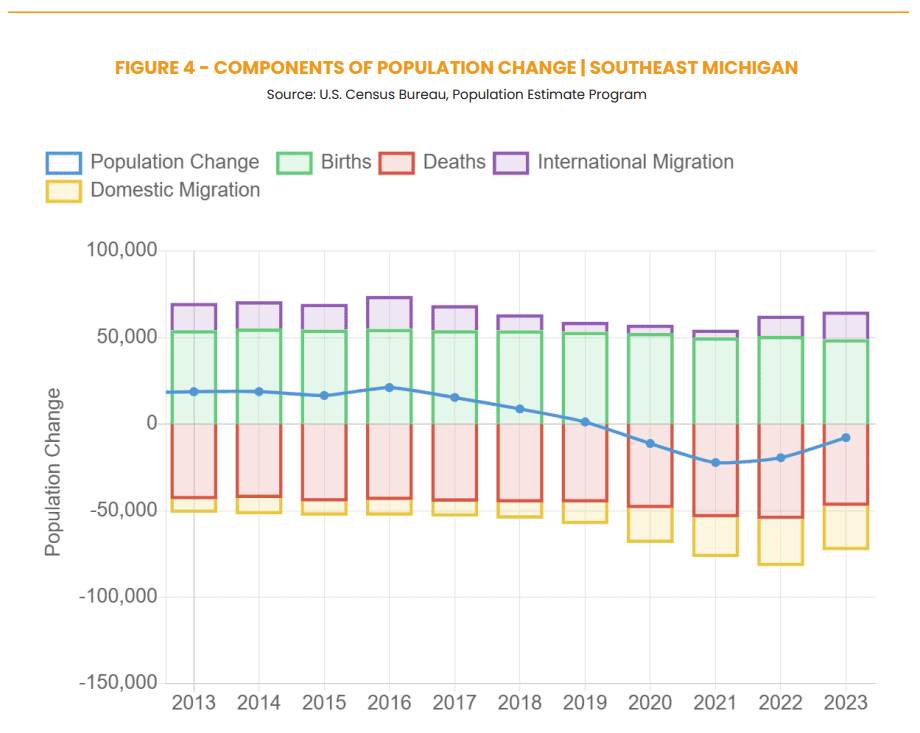
If we look at metrics measuring place, Figure 4 shows an improvement in our region’s population change. Southeast Michigan’s population declined in 2023, but less so than in previous years. The improvements are attributed to three factors:
- For the first time since 2020, births outnumbered deaths
- Domestic migration, while still negative, was less so in 2023 than in 2022
- International migration increased over 2022
Births outnumbered deaths by almost 1,800 people. Domestic migration improved from -27,314 in 2022 to -25,522 in 2023, a difference of almost another 1,800 people. International migration increased from 11,660 in 2021 to 15,893 in 2022, a gain of more than 4,000 people. Estimates for 2024 by state from the U.S. Census Bureau indicate further population improvement in Michigan in 2024.
Housing Costs
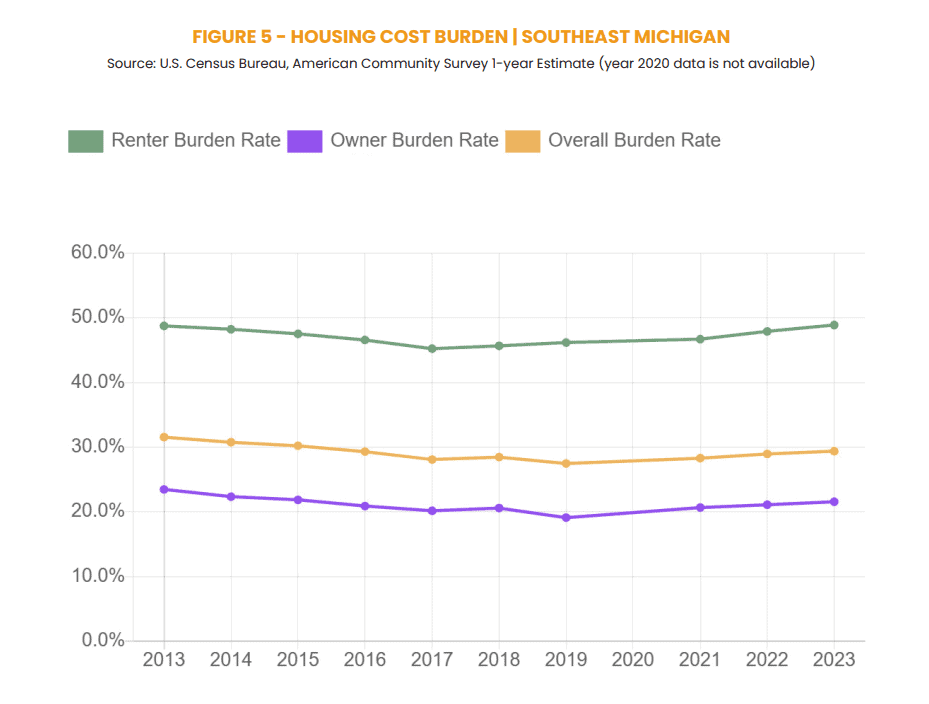
One metric that has not been improving is housing costs. Figure 5 shows the housing cost burden for the region’s households is on an upward trajectory in 2023. Housing cost burden is defined as the percentage of households paying 30% or more of their income towards housing. The percentage of all cost-burdened households increased from 28.9% in 2022 to 29.4% in 2023. The owner burden rate rose from 21.1% to 21.6%, while the renter burden rate rose from 47.9% to 48.9%.
Household income
Lastly, it is also important to focus on income growth. The region’s real median household income declined by 1.8%, or by $1,355 from 2022, showing that household incomes could not keep up with recent inflation (Figure 6).
Median Earnings
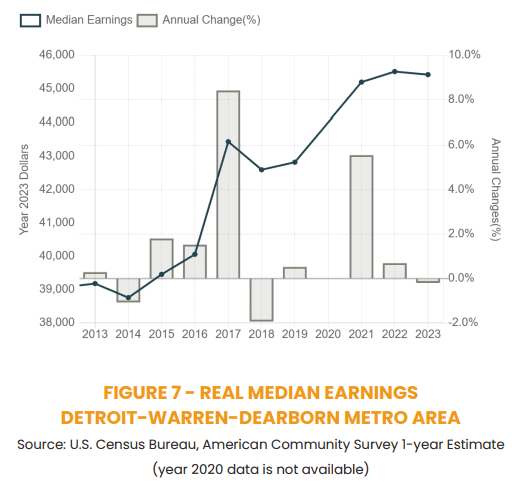
If there is a piece of good news, it is that real median earnings have fared better. Note – while real median income measures the inflation-adjusted levels of income from all regularly-occurring sources like wages, salaries, retirement, and Social Security, real median earnings is a subset that measures inflation-adjusted levels of income received in return for labor or services. The region’s real median earnings decreased by $91, or 0.2%. Since 2019, real median earnings increased by 6.1%, or at an annual rate of 1.5% (Figure 7).


Leave a Reply